<?xml version="1.0" encoding="utf-8"?><feed xmlns="http://www.w3.org/2005/Atom" ><generator uri="https://jekyllrb.com/" version="3.10.0">Jekyll</generator><link href="https://jackcook.com/feed.xml" rel="self" type="application/atom+xml" /><link href="https://jackcook.com/" rel="alternate" type="text/html" /><updated>2025-12-10T04:57:14+00:00</updated><id>https://jackcook.com/feed.xml</id><title type="html">personal-site</title><subtitle>My personal website with some of my projects and other stuff</subtitle><entry><title type="html">When Machine Learning Tells the Wrong Story</title><link href="https://jackcook.com/2024/11/09/bigger-fish.html" rel="alternate" type="text/html" title="When Machine Learning Tells the Wrong Story" /><published>2024-11-09T00:00:00+00:00</published><updated>2024-11-09T00:00:00+00:00</updated><id>https://jackcook.com/2024/11/09/bigger-fish</id><content type="html" xml:base="https://jackcook.com/2024/11/09/bigger-fish.html"><![CDATA[<p>In June 2022, three short weeks after my college graduation, I presented at ISCA, my first serious research conference.
Onstage with my co-author <a href="https://www.drean.io/">Jules Drean</a>, we gave a 15-minute talk about our hardware security research paper, <a href="https://jackcook.github.io/bigger-fish/" target="\_blank">There’s Always a Bigger Fish: A Clarifying Analysis of a Machine-Learning-Assisted Side-Channel Attack</a>, that had taken the majority of my last two years at MIT to complete.
In hindsight, that talk was the culmination of one of my proudest accomplishments from my time in college.
The paper has since won awards and recognition, including first place in <a href="https://www.intel.com/content/www/us/en/security/security-practices/security-research/hardware-security-academic-award.html" target="\_blank">Intel’s 2024 Hardware Security Academic Award</a>,<sup><a href="#fn1" id="ref1">1</a></sup> and inclusion in the 2023 edition of <a href="https://ieeexplore.ieee.org/document/10167515" target="\_blank">IEEE Micro Top Picks</a>, which highlights 12 of the best papers in computer architecture each year.</p>

<p>Since our talk, every few months, I’ve gotten the urge to write a blogpost about the paper.
Among other cool things described in the paper, we…</p>

<ul>
  <li>Implemented a powerful machine-learning-assisted side-channel attack that can be pulled off in any modern web browser</li>
  <li>Demonstrated for the first time in the literature that <a href="https://en.wikipedia.org/wiki/Interrupt" target="\_blank">system interrupts</a>, a low-level mechanism that your operating system uses to interact with hardware devices, can leak information about user activity</li>
  <li>Learned a valuable lesson about the dangers of applying machine learning toward hardware security research</li>
</ul>

<p>I think some of these lessons are widely applicable, even outside of hardware security research.
But each time I’ve started writing, a few hundred words into the draft, I’ve stopped writing and put the post away.
For some reason, it always felt wrong.
Two years later, no blogpost exists.
If I could write about <a href="/2024/02/23/mamba.html" target="\_blank">other people’s research</a>, why couldn’t I write about my own?
I only recently figured out why.</p>

<p>As I’ll get into, one reason this is a hard post to write is because there’s a lot going on in this research paper.
I like writing for a general technical audience, and I need to explain a lot of background before I can get to the good stuff.
The paper also has two competing stories: one about how machine learning models can be used to attack web browsers, and another about how these same models are often misunderstood, leading them to be applied incorrectly.
But there’s also a third story embedded in this paper, about how this paper completely altered the trajectory of my life.
This is a post about machine learning, computer architecture, and more, but also about myself, how I got into research and academia, and how one great mentor can change everything.</p>

<hr />

<figure id="cpu-selection" class="fullwidth whitebg">
  <h3>Select your CPU</h3>
  <div style="width: 90%; margin: 0 auto 8px;">
    <p>
      This post contains demos and details that can be customized to your CPU. If you know your processor, you may search for it below:
    </p>
    <select id="cpu-picker" autocomplete="off">
      <option value="">Select your CPU...</option>
    </select>
    <p style="margin-top: 24px;">
      Otherwise, feel free to pick a sample CPU from the list below:
    </p>
    <div class="sample-buttons">
      
      <button onclick="selectCPU('AMD Ryzen 5 7600', event)" data-cpu="AMD Ryzen 5 7600"><img src="/img/blog/bigger-fish/ryzen.png" alt="Mid-tier AMD CPU (Ryzen 5 7600)" /> Mid-tier AMD CPU (Ryzen 5 7600)</button>
      
      <button onclick="selectCPU('Apple A18', event)" data-cpu="Apple A18"><img src="/img/blog/bigger-fish/iphone.png" alt="Apple A18 (in the iPhone 15)" /> Apple A18 (in the iPhone 15)</button>
      
      <button onclick="selectCPU('Apple M3', event)" data-cpu="Apple M3"><img src="/img/blog/bigger-fish/macbook.png" alt="Apple M3 (in 2023 MacBooks)" /> Apple M3 (in 2023 MacBooks)</button>
      
      <button onclick="selectCPU('Intel Core i9-10900K', event)" data-cpu="Intel Core i9-10900K"><img src="/img/blog/bigger-fish/intel-i9.png" alt="High-end Intel CPU (i9-10900K)" /> High-end Intel CPU (i9-10900K)</button>
      
      <button onclick="selectCPU('Snapdragon 8 Gen 3', event)" data-cpu="Snapdragon 8 Gen 3"><img src="/img/blog/bigger-fish/s24.png" alt="Snapdragon 8 Gen 3 (in the Samsung Galaxy S24)" /> Snapdragon 8 Gen 3 (in the Samsung Galaxy S24)</button>
      
    </div>
  </div>
</figure>

<hr />

<p>It was September 2020, the start of my junior year at MIT, and I had just enrolled in <a href="https://csg.csail.mit.edu/6.S983/" target="\_blank">Secure Hardware Design</a>, a graduate seminar class that was being offered for the first time.
Nearly all of my past experience had been in software, and I saw the class as a great opportunity to branch out and learn new things.</p>

<p>I quickly found out I was in over my head.
Each week, we would read and discuss two recent hardware security research papers as a class.
Of the 10 or so students who came each week, I was one of only two undergrads, and half of the PhD students weren’t even enrolled in the class—they just wanted to discuss the papers for fun.
I felt that I had very little to contribute to the discussions compared to the wealth of experience everyone else brought to the table, but I was happy to listen nonetheless.</p>

<p>Alongside the paper discussions, each student was supposed to complete a final project.
I met with our professor, <a href="https://people.csail.mit.edu/mengjia/" target="\_blank">Mengjia Yan</a>, early on in the semester to discuss where I should start.
I told her about my prior experience with web development and machine learning, and she suggested I try to reimplement a recently published website fingerprinting attack, which relies on machine learning to exploit weaknesses in hardware.
Her gut told her that there was something wrong with the state-of-the-art research in that area, but she couldn’t put her finger on what it was.</p>

<h2 id="a-primer-on-side-channel-attacks">A primer on side-channel attacks</h2>

<p>In a perfect world, applications on your computer should always operate independently of each other.
For example, if you have Netflix and Spotify open at the same time, Spotify should never be able to know what movie you’re watching.
In practice, this is mostly kept true because of a mechanism known as <a href="https://en.wikipedia.org/wiki/Process_isolation" target="\_blank">process isolation</a>, through which your operating system keeps applications separate from each other by making them use separate resources.
For example, applications are given their own private memory space to store their data, and are restricted from accessing memory that belongs to another process.</p>

<figure class="whitebg evenlesswidth">
  <img src="/img/blog/bigger-fish/Virtual_memory.svg" />
  <figcaption>Credit: <a href="https://en.wikipedia.org/wiki/Virtual_memory#/media/File:Virtual_memory.svg" target="_blank">Ehamberg, 2009</a></figcaption>
</figure>

<p>However, process isolation is highly imperfect.
At the end of the day, you’re running Netflix and Spotify on the same computer, and they still share a lot of resources.
For example, they both use the same network card to fetch data from the Netflix and Spotify servers.
They use the same graphics card to display data on your screen.
They use the same processor to run their application code.
And so on and so forth.</p>

<p>Consider why this type of resource sharing, however limited, might compromise security.
Let’s say your roommate recently admitted to you that they’ve watched 20 movies in the last week.
They know they’re addicted and need to focus on their work, but they can’t stop watching movies, and they need your help.
To hold them accountable, it’s now up to you to figure out when they’re watching a movie, so you can go knock on their door and tell them to stop.
There are two important facts that will help you solve this problem:</p>

<ol>
  <li>Movies are very large files. Streaming one typically creates a lot of network activity.</li>
  <li>You both share the same Wi-Fi router.</li>
</ol>

<p>One solution might involve periodically downloading a large file and measuring how long each download takes.
If you notice that a download takes longer than usual, and this pattern holds for some period of time, you might begin to suspect that something is up.
Why is the download taking longer? Have you ever asked a relative to stop watching a movie because you needed to take an important call on the same Wi-Fi network, or turned off video on your Zoom call so that the audio would cut out less often? Your Wi-Fi router can only handle so much activity at once, and since you and your roommate are sharing the same router, your network activity is impacted by theirs.
You should go tell your roommate to stop watching their 21st movie of the week.</p>

<p>In this way, your Wi-Fi router creates a <em>side channel</em>, because it essentially reveals information about its users by accident.
This side channel is extremely crude, only able to transmit one bit of information at a time (1 = roommate is watching movie, 0 = roommate is not watching movie), but it still illustrates a very important concept: nearly every shared resource reveals information about its users by accident.
And when it comes to modern computers, there are lots of shared resources, which create lots of side channels.</p>

<p>
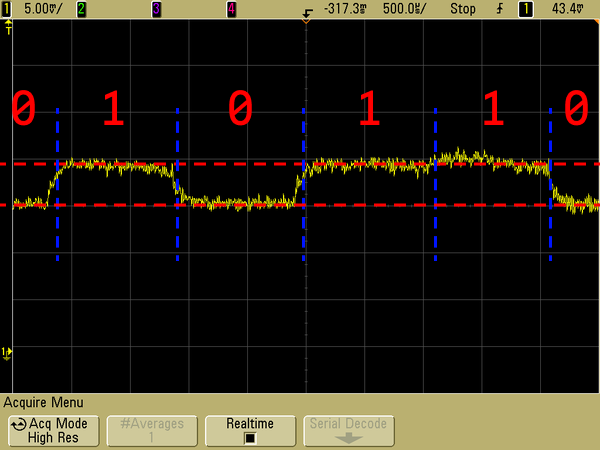
Some notable examples of side channels that we learned about in Mengjia’s class blew my mind.
For example, it’s been known for some time that changes in a computer’s power consumption can be used as a side channel.
In the figure below, you can see a device’s power consumption, shown in yellow, reliably increasing and decreasing during RSA encryption, enabling you to identify the 1s and 0s that make up a user’s encryption key.
An <a href="https://link.springer.com/book/10.1007/978-0-387-38162-6" target="\_blank">entire book</a> was written about this type of attack over 15 years ago!</p>

<figure class="whitebg">
<img src="/img/blog/bigger-fish/power-attack.png" />
<figcaption>Credit: <a href="https://en.wikipedia.org/wiki/Power_analysis#/media/File:Power_attack_full.png" target="_blank">Audriusa, 2010</a></figcaption>
</figure>

<p>Similarly, every device, from your laptop to your contactless credit card, emits electromagnetic radiation, since any wire carrying a current creates a small magnetic field (remember the right-hand rule?).
In a similar way to the power-analysis attack described above, you can monitor changes in this EM signal to reverse-engineer encryption keys, user activity, and more.
I could go on and on.
In most cases, though, these types of attacks are impractical to pull off—you need specialized equipment to monitor electromagnetic signals, and it’s hard to look at this signal and tell if someone is encrypting a message or just watching <a href="https://www.youtube.com/watch?v=pRpvdcjkT3k" target="\_blank">cat videos on YouTube</a>.
However, some side-channel attacks are much easier to pull off.
Let’s get back to the topic at hand.</p>

<h2 id="what-is-website-fingerprinting">What is website fingerprinting?</h2>

<p>Now, imagine you have two tabs open in your web browser.
One is a big social media platform that wants to collect as much data about you as possible in order to serve better targeted advertisements.
I don’t want to name an actual social media platform, so I’ll just make one up: let’s call it Facebook.<sup><a href="#fn2" id="ref2">2</a></sup>
In the other tab, you have a website open that you’d prefer “Facebook” didn’t know about—maybe it reveals something about your identity (e.g. <a href="https://en.wikipedia.org/wiki/Truth_Social" target="\_blank">Truth Social</a>) or something you’d otherwise be ashamed for other people to know about (e.g. Taylor Swift fan page).
How could Facebook figure out what website you have open in this other tab?</p>

<p>Facebook could turn to website fingerprinting to solve this problem.
When Mengjia and I discussed my final project, she pointed me to a paper by <a href="https://www.usenix.org/conference/usenixsecurity19/presentation/shusterman" target="\_blank">Shusterman et al.</a> that explores this exact setup, where one website attempts to identify the website open in another tab out of a set of 100 possible websites.
They claimed to do this by taking advantage of a widely-studied side channel: the CPU cache.
Their idea worked as follows: while your computer loads a website (or does anything, for that matter), it saves lots of data in small CPU caches in order to reduce the number of times it needs to load data from RAM or from your hard drive, both of which are much slower.</p>

<figure class="whitebg morewidth">
  <img src="/img/blog/bigger-fish/cpu-cache.svg" />
  <figcaption class="top-padding">Very simplified explanation of where CPUs get their data.</figcaption>
</figure>

<p>However, caches, like your Wi-Fi router, are shared resources, and they are generally very small.
If RAM is a library that holds hundreds of thousands of books, the CPU cache might be a single bookshelf by the front door with a few of the most popular titles.
When someone requests a book, if it’s on that bookshelf, they will get their book almost instantly.
If not, they can go look for it in the library, but it will take much longer.
The problem here is that your bookshelf will inevitably fill up, because it holds a fraction of the contents of the library.
If you have two programs running on your computer, they will need to share the same CPU cache, which is also being used by your operating system and whatever other applications you have open at the time.</p>

<p>Now if you think about it, when you open any website, perhaps you’ve opened <a href="https://jackcook.com" target="\_blank">jackcook.com</a>, it will load in basically the same way every time.
It will reference the same scripts, images, and stylesheets, and it will render the same content on the page.
And in theory, this should translate to very similar cache activity each time the website loads.
This is where website fingerprinting comes in.
To try to take advantage of this CPU-cache side channel, Shusterman et al. designed an attacker that worked as follows:</p>

<ol>
  <li>Allocate an array that’s the same size as the CPU cache<sup><a href="#fn3" id="ref3">3</a></sup> and fill it with ones.</li>
  <li>While a website loads in another tab, every 2 milliseconds, measure how long it takes to loop over the array and access every element.<sup><a href="#fn4" id="ref4">4</a></sup></li>
  <li>Repeat step 2 for 15 seconds.</li>
</ol>

<p>By the end of this process, making one measurement every 2 milliseconds for 15 seconds, the attacker will have 7500 measurements in total.
Now, let’s consider for a moment why an individual measurement might be higher or lower, and remember that you’re opening another website while this happens, the one you don’t want “Facebook” to know about.</p>

<p>Facebook, which I will now refer to as the <em>attacker</em>, and the other website you’re loading, which I will now refer to as the <em>victim</em>, share <em>a lot</em> of resources on your computer.
One of these shared resources is the CPU cache: using the analogy from earlier, imagine the attacker and victim each have their own libraries with their own data, but they have to share space on the same small bookshelf to cache this data.
<cpu data-value="name" data-prefix="Your " data-suffix=" has" data-requiredvalue="cache">A typical CPU might have</cpu> a cache that can hold <cpu data-value="cache" data-requiredvalue="cache">around 6-8 MB</cpu> of data, enough to hold about <cpu data-value="cache/4" data-requiredvalue="cache">2 million</cpu> integers.
When the attacker then creates its <cpu data-value="cache" data-requiredvalue="cache">cache-sized</cpu> array, it will fill this cache, evicting all of the data it currently holds.
But at some point, as the victim website loads, it will have data of its own, which the CPU will put in its cache, evicting some of the attacker’s data.</p>

<p>
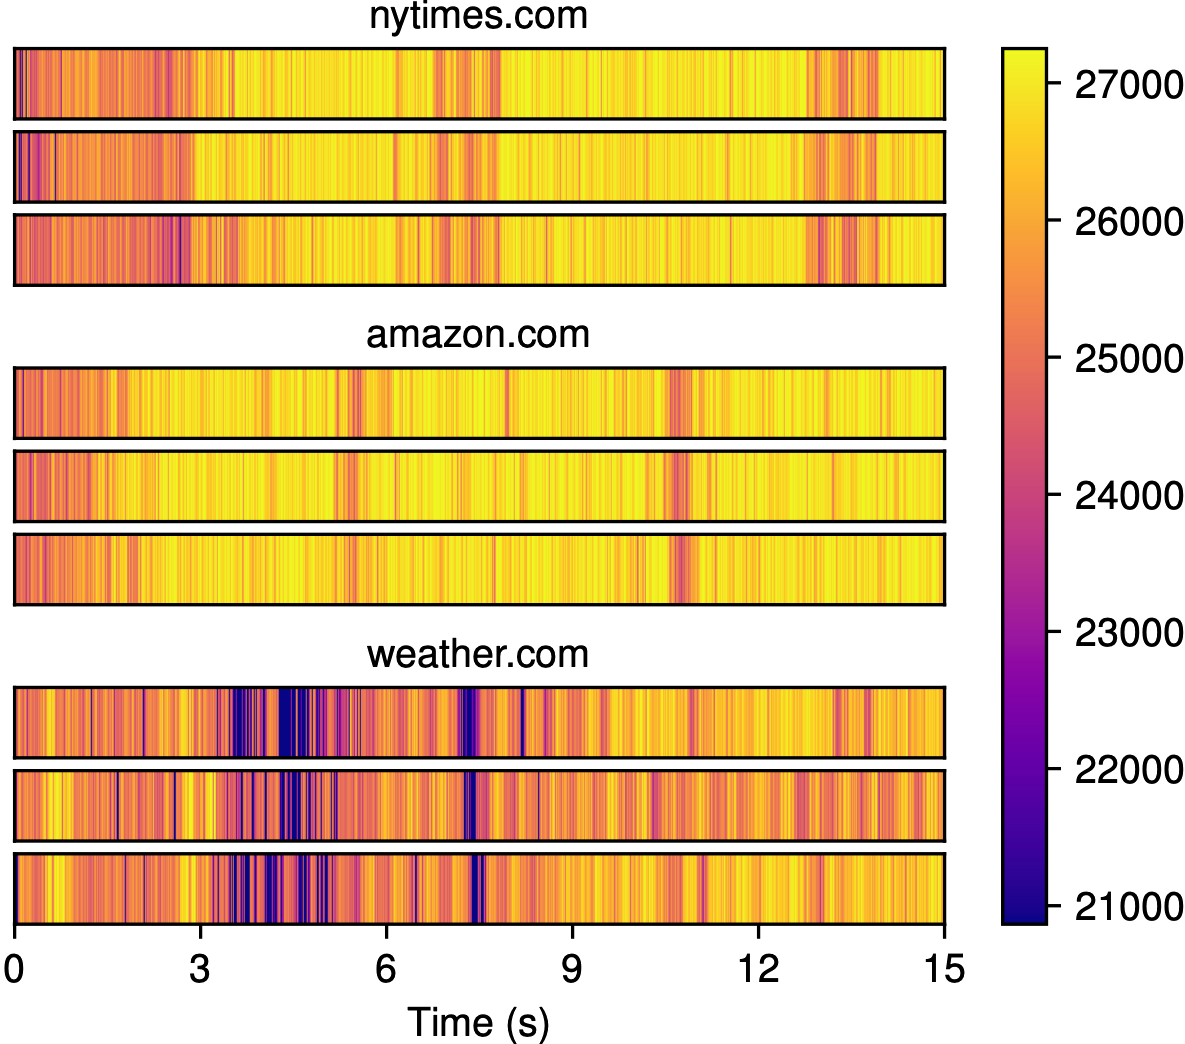
But then, 2 milliseconds later, the attacker will read all of its data again, and the CPU will first look for this data in the cache.
If any of the attacker’s data was removed from the cache in the last 2 milliseconds, it will take a tiny bit longer to do this, because the CPU will need to spend time looking for it in RAM.
And because the attacker is timing how long this process takes, it will notice this tiny discrepancy.
This process will then repeat itself 7,500 times over the course of the next 15 seconds.
And since websites generally load in the same way every time, these measurements should reflect the unique cache access patterns of the website you’ve opened.
In the figure below, you can see how these measurements look for three different websites, where time increases to the right, and darker colors indicate slower cache accesses.</p>

<figure class="whitebg">
  <img src="/img/blog/bigger-fish/shusterman-fig3.png" />
  <figcaption>Figure 3 from <a href="https://www.usenix.org/conference/usenixsecurity19/presentation/shusterman" target="_blank">Shusterman et al., 2019</a></figcaption>
</figure>

<p>
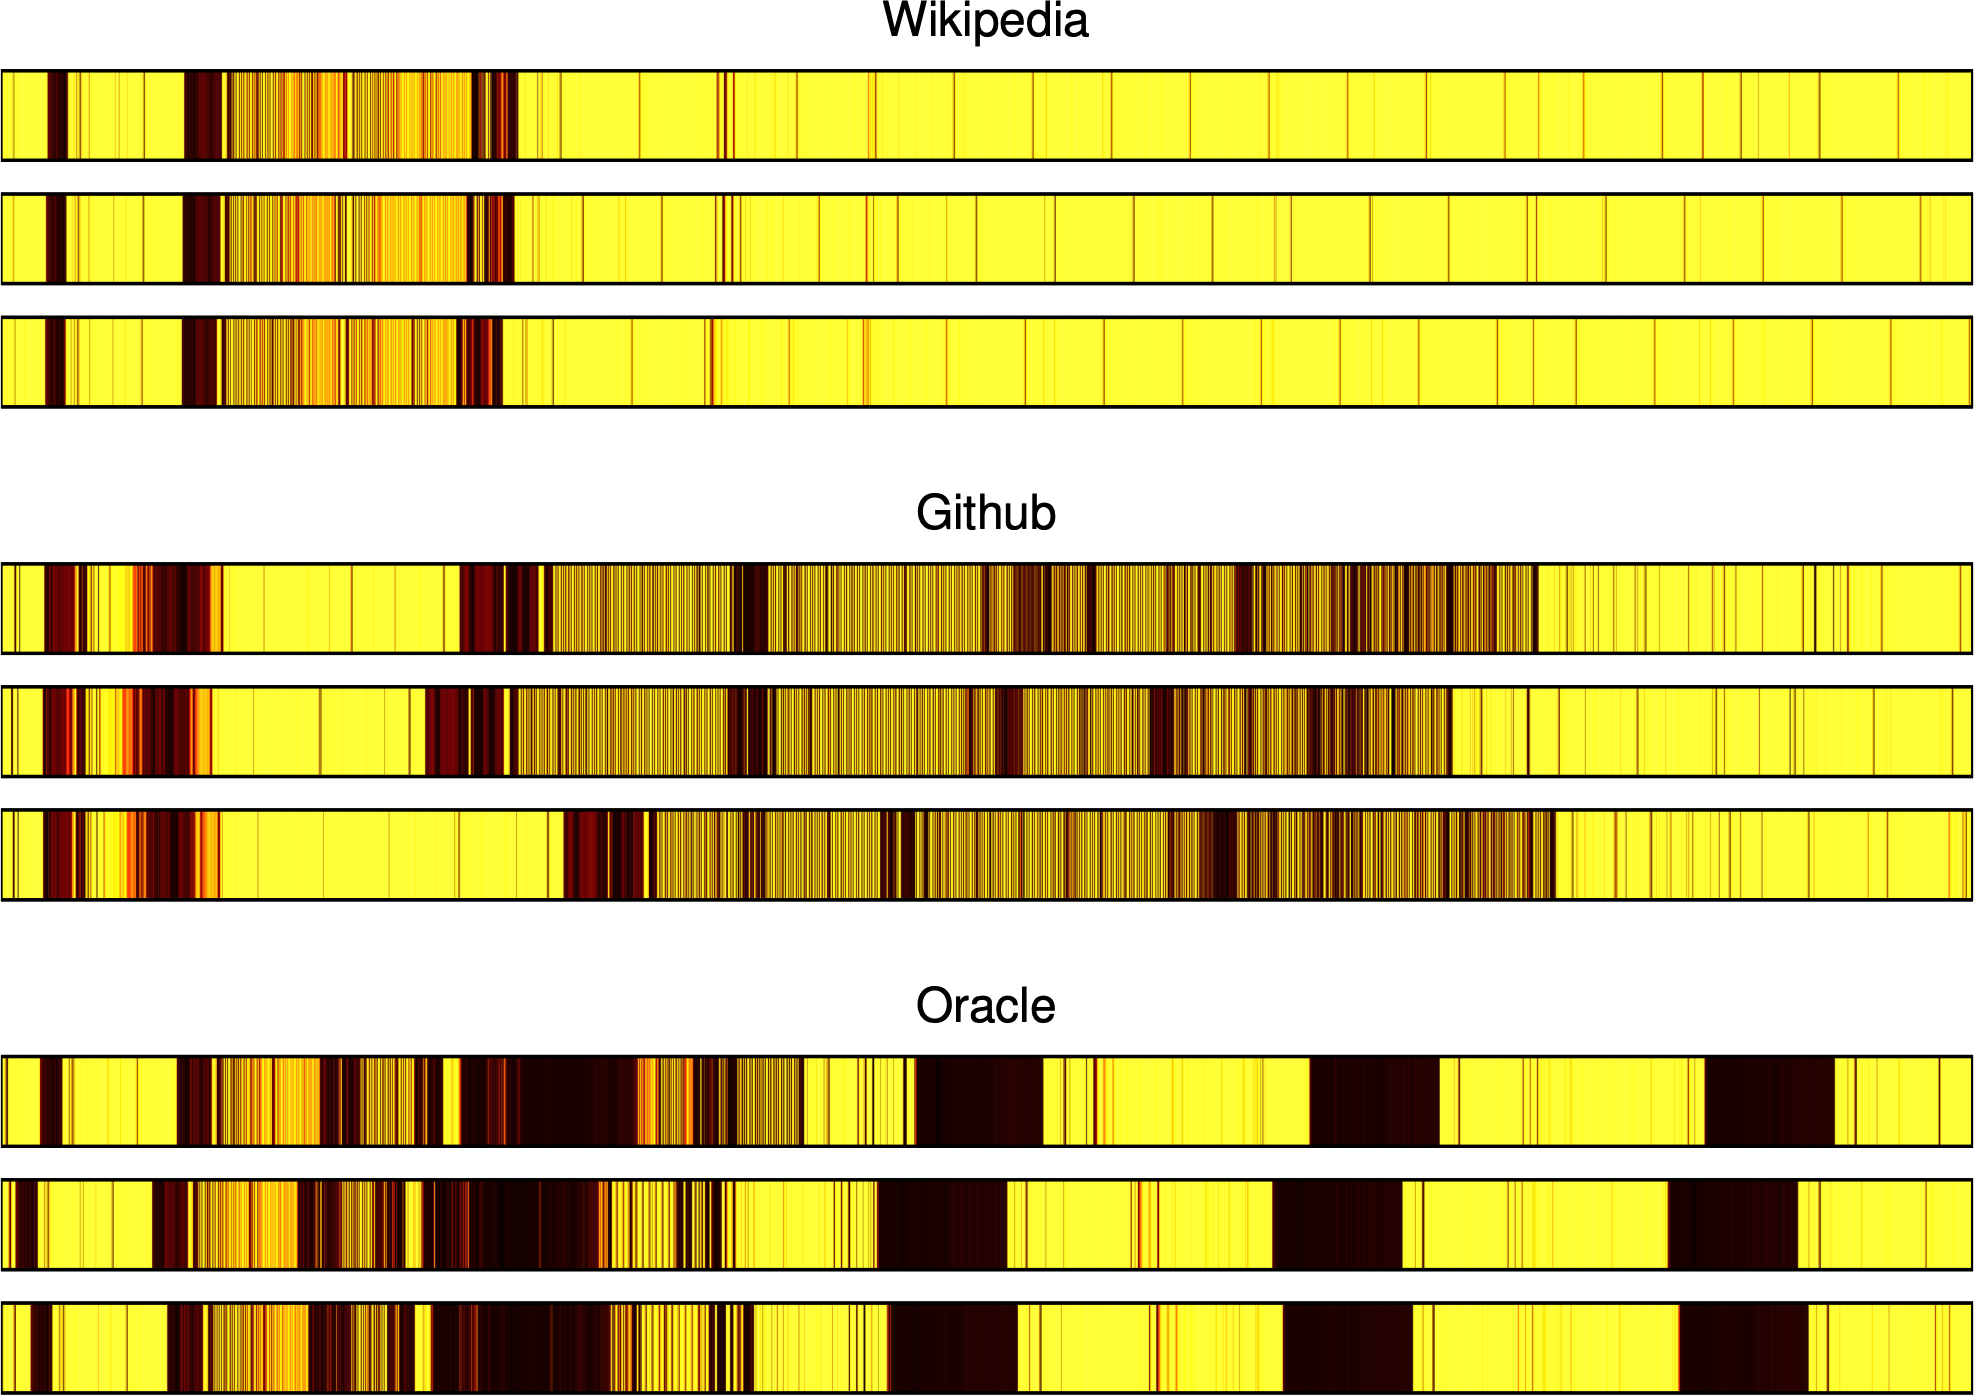
Notice how within each website, the traces look very similar, but across different websites, the traces look very different.
This is where website fingerprinting gets its name: each collection of latency measurements, which we call a <em>trace</em>, essentially acts as a “fingerprint” that can be used to identify the website that was loaded.
If I gave you a new trace from one of these websites and asked you to tell me which one it came from, you could probably compare it to the traces above and give me the answer.</p>

<p>Click the start button below to see this process in action by recording <smallscreen data-value="50">100</smallscreen> milliseconds of cache latency measurements on your own device.
Then, hover over or tap on the values in the trace to see what each measurement represents.
This demo works best in Chrome, but it should work fine in other browsers as well.<sup><a href="#fn5" id="ref5">5</a></sup>
<cpu data-value="name" data-prefix="The slider below has been automatically set to your " data-suffix="’s cache size of "></cpu><cpu data-value="cache" data-suffix=", but if">If</cpu> all of your bars have the same color, try adjusting the cache size.</p>

<figure class="fullwidth whitebg">
  <div class="demo" data-attackertype="cache"></div>
</figure>

<p>Now, let’s go back to the example from earlier.
Imagine you’re “Facebook,” and you want to identify the websites your users are opening in their other tabs.
How would you do this?
First, you might collect a bunch of traces while opening a lot of different websites, similar to the ones above, which you can use as training data.
With this training data, you can train a machine learning model, which can reliably predict the website that was opened while recording one of these traces.
Then, when users open “Facebook” in the future, “Facebook” can record new traces, feed them into this model, and see if there’s a match.</p>

<p>This is what Shusterman et al. did: in their paper, they collected 100 traces for 100 different websites, yielding a labeled dataset of 10,000 traces, and used it to train a few machine learning models.
They then repeated this process across several different web browsers and operating systems, and found that it was possible to identify the website that was opened out of a set of 100 possible websites with up to 91.4% accuracy.<sup><a href="#fn6" id="ref6">6</a></sup>
Pretty cool, and a little scary!</p>

<figure class="whitebg">
  <div class="table-container">
    <table>
      <thead>
        <tr>
          <th style="text-align: left">Web Browser</th>
          <th style="text-align: left">Operating System</th>
          <th style="text-align: right">Classification Accuracy</th>
        </tr>
      </thead>
      <tbody>
        <tr>
          <td style="text-align: left">Chrome</td>
          <td style="text-align: left">Linux</td>
          <td style="text-align: right">91.4% ± 1.2%</td>
        </tr>
        <tr>
          <td style="text-align: left">Chrome</td>
          <td style="text-align: left">Windows</td>
          <td style="text-align: right">80.0% ± 1.6%</td>
        </tr>
        <tr>
          <td style="text-align: left">Firefox</td>
          <td style="text-align: left">Linux</td>
          <td style="text-align: right">80.0% ± 0.6%</td>
        </tr>
        <tr>
          <td style="text-align: left">Firefox</td>
          <td style="text-align: left">Windows</td>
          <td style="text-align: right">87.7% ± 0.8%</td>
        </tr>
        <tr>
          <td style="text-align: left">Safari</td>
          <td style="text-align: left">macOS</td>
          <td style="text-align: right">72.6% ± 1.3%</td>
        </tr>
        <tr>
          <td style="text-align: left">Tor Browser</td>
          <td style="text-align: left">Linux</td>
          <td style="text-align: right">46.7% ± 4.1%</td>
        </tr>
      </tbody>
    </table>
  </div>
  <figcaption>An abbreviated version of Table 2 from Shusterman et al., 2019</figcaption>
</figure>

<h2 id="my-final-project">My final project</h2>

<p>I spent the next few weeks trying to replicate these results from Shusterman et al.’s paper.
Going into this project, I wasn’t too sure what I would find.
Mengjia and I decided I should look at website fingerprinting because I had past experience with web development and machine learning, and not because there was an obvious unresolved research question.
I collected a bunch of data and tried to distinguish between four websites at a time, which was fairly straightforward.</p>

<figure class="whitebg">
  <img src="/img/blog/bigger-fish/initial-eval.png" />
  <figcaption class="top-padding">My very first results, showing 40 traces per website recorded while opening cnn.com, msnbc.com, nytimes.com, and apple.com.</figcaption>
</figure>

<p>
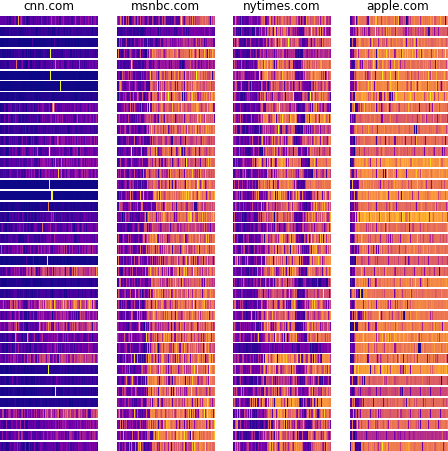
Even if you just looked at these traces with your own eyes, there are clear patterns that distinguish these websites from each other.
If I gave you a new trace, you could probably tell me which website it came from.
But of course, models do this faster and more reliably.
By training a simple Random Forest classifier on these traces, I was able to predict the correct website with 98% accuracy.
Scaling this up to 10 websites initially gave me 75% accuracy, but over the next several weeks, I kept experimenting and making improvements until I could reliably classify 10 websites, then 50, then 100.</p>

<p>While many of these experiments led to small improvements, one stood out above the rest.
Remember that in Shusterman et al.’s paper, the attacker works by repeatedly measuring how long it takes to access all of the elements in its array.
For one of my experiments, I tried a different approach: I simply made the attacker count as fast as it could (like literally, execute <code class="language-plaintext highlighter-rouge">value++</code> over and over again).
In the demo below, click Start and hover over or tap on the final trace to see how high your computer can count in 5 seconds.</p>

<figure class="fullwidth whitebg">
  <div class="demo" data-periodlength="5000" data-configurable="false"></div>
</figure>

<p>Of course, this number doesn’t tell us too much on its own.
However, if we do this repeatedly, we can see how fast your computer can count over time.
Now see how high your computer can count in one second, five times in a row.</p>

<figure class="fullwidth whitebg">
  <div class="demo" data-periodlength="1000" data-configurable="false"></div>
</figure>

<p>As we make this interval smaller, we can see how this plays out at a finer timescale.
Again, hover over or tap on the values in these traces to see what each measurement represents.</p>

<figure class="fullwidth whitebg">
  <div class="demo" data-periodlength="100" data-tracelength="10000" data-smallscreenperiodlength="200" data-showvalues="false" data-formattooltip="false"></div>
</figure>

<p>Now, play with the demo above to see if you can get the trace to change.
If you do nothing, the values should stay relatively consistent over time.
But if you click start and then do something else on your device, such as opening a new tab or resizing the browser window, you should see this reflected in the trace.
If you’re having trouble with this, you can see an example below:</p>

<figure class="whitebg fullwidth">
  <video class="video-js" controls="" preload="auto" data-setup="{&quot;fluid&quot;: true}" style="border: 1px solid #ddd; border-radius: 4px;">
    <source src="/img/blog/bigger-fish/google-maps-demo.mp4" type="video/mp4" />
    <p class="vjs-no-js">
      To view this video please enable JavaScript, and consider upgrading to a web browser that
      <a href="https://videojs.com/html5-video-support/" target="_blank">supports HTML5 video</a>
    </p>
  </video>
  <figcaption>When I open Google Maps in a new tab, the trace values drop. This enables the attacker to notice that something else is happening on my computer, even though process isolation is supposed to make this impossible.</figcaption>
</figure>

<p>Take a second to think about what’s happening here.
In the video above, over the course of 5 seconds, my computer tried to count as fast as it could.
Every 100 milliseconds, we saved the value it reached, and made it start over again from zero.
As was the case with the cache-based attacker, this trace is sensitive to things that happen outside of the same browser tab: when I opened Google Maps, my computer couldn’t count as high.</p>

<p>This shows that this counter trace can essentially be interpreted as a signal.
We can improve the resolution of this signal by saving the value more often: while I saved the value every 100 milliseconds in my demo to illustrate the concept of our counting-based attack, in our paper, we save the value every 5 milliseconds to get more information in a fixed amount of time.
In the demo above, you can change this value, which we call the <em>period length</em>, to record counter traces at a higher or lower resolution.
A simple version of the trace collection code is shown here in Python, which you can read or try for yourself:</p>

<pre><code class="language-python">import time

PERIOD_LENGTH = 0.1  # 0.1 second
TRACE_LENGTH = 5  # 5 seconds
start = time.time()
counter = 0
trace = []

while len(trace) &lt; int(TRACE_LENGTH / PERIOD_LENGTH):
    if time.time() - start &gt;= PERIOD_LENGTH:
        trace.append(counter)
        start = time.time()
        counter = 0
        continue

    counter += 1

print(trace)</code></pre>

<hr />

<p>I ran the experiment, training a model on these counter traces rather than using the cache-latency traces we discussed earlier.
And as it turned out, models trained on the counter traces were more accurate at predicting the website that was opened!</p>

<p>This was a really exciting result!
The theory behind Shusterman et al.’s paper was that their attacker leveraged a CPU-cache-based side channel by repeatedly evicting data from the cache and measuring cache access latency.
But my new attacker simply incremented a counter, without needing to repeatedly evict data from the cache, and it appeared to yield an even better signal.
There was no solid theory behind it.
Why did it work so well?</p>

<p>I presented my findings during the final lecture of Secure Hardware Design, and Mengjia was even more excited than I was.
A few days after that lecture, she sent me the following email:</p>

<blockquote>
  <p>Hi Jack,</p>

  <p>Great job on the 6.888 course project!
As I have commented during the lecture, your work is really impressive.</p>

  <p>I am wondering whether you will be interested in continuing the project in my group.
My group offers [undergraduate research] opportunities.
I am very curious about why your new measurement approach could do a better job than cache-contention attacks.
By digging deep into it and figuring out the reason, we can potentially find something unknown to the public related to how the browser or hardware processor works, and get a potential publication in a top security or computer architecture conference.</p>

  <p>If you are interested, we could chat about details after your finals and the holiday season.</p>

  <p>Thanks,
Mengjia</p>
</blockquote>

<p>I didn’t realize it at the time, but I had accidentally discovered a new side channel.</p>

<h2 id="investigating-the-mystery-side-channel">Investigating the mystery side channel</h2>

<p>
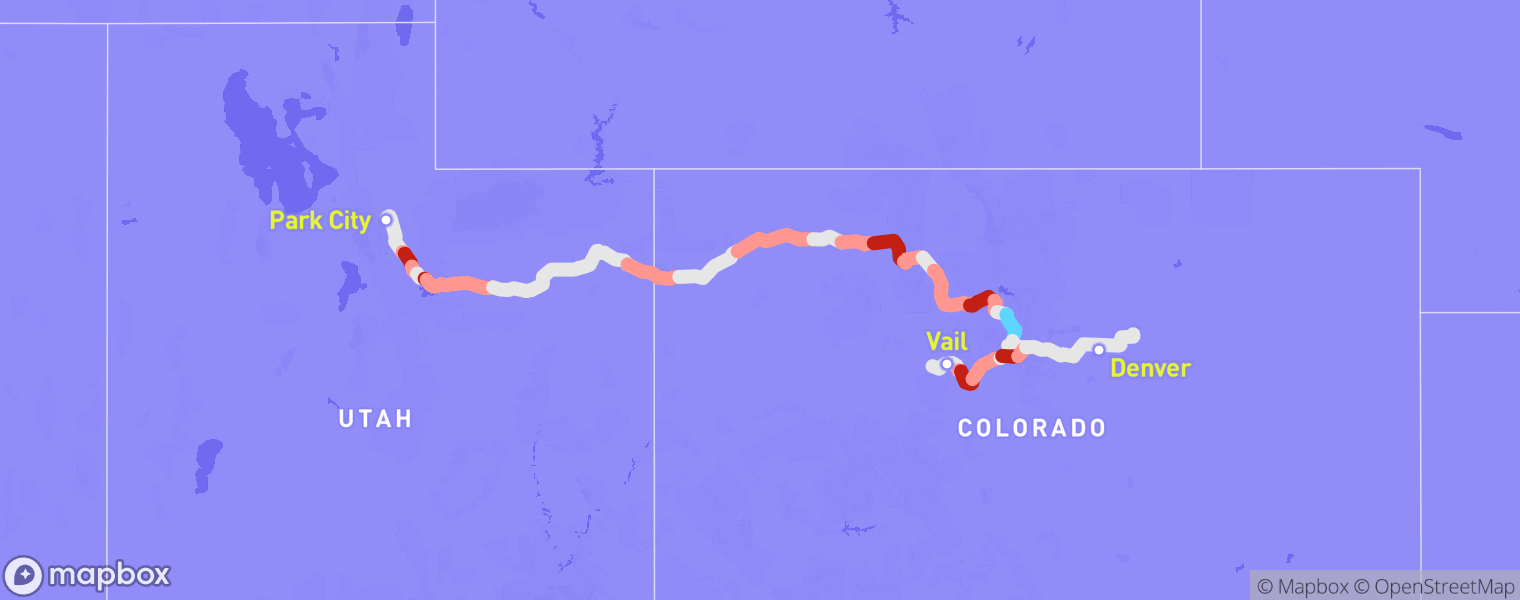
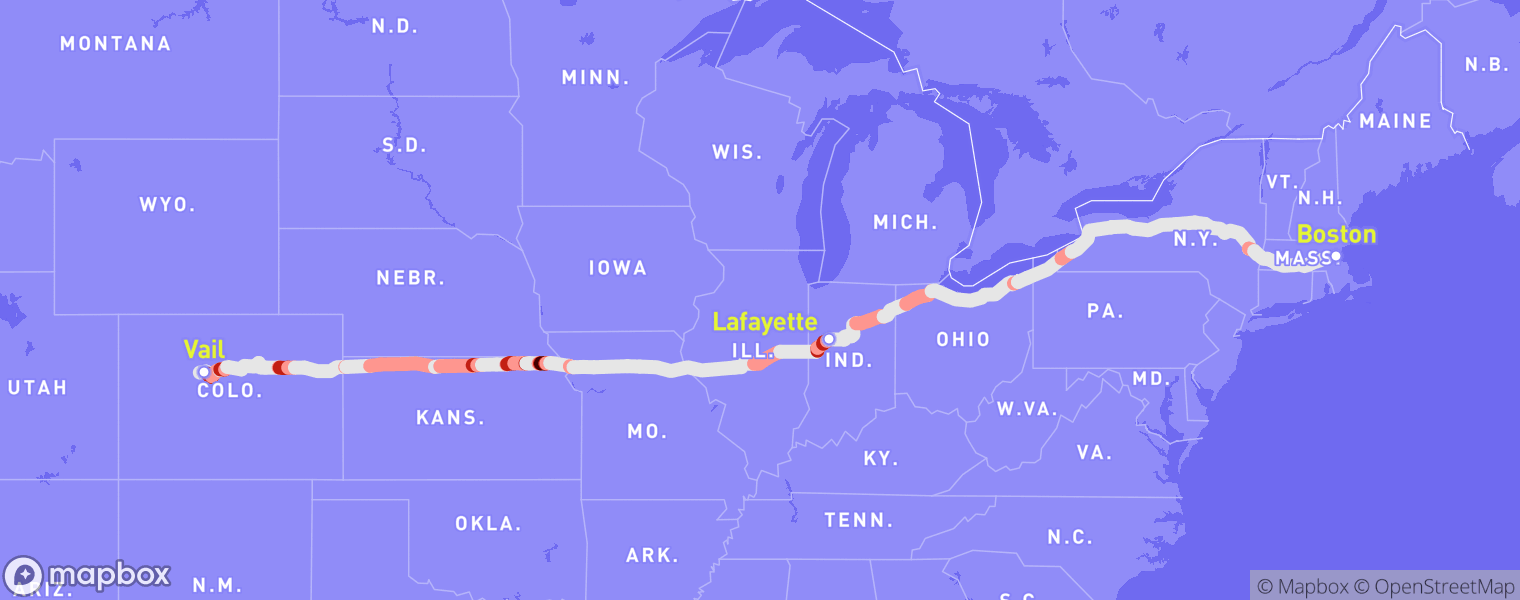
I called Mengjia several weeks later, after the end of my <a href="/2022/04/11/tmobile.html" target="\_blank">6-week roadtrip across the US</a>, and joined her lab in February 2021.
She introduced me to <a href="https://www.drean.io" target="\_blank">Jules Drean</a>, a talented graduate student who studies micro-architectural side-channel attacks such as this one, and the three of us immediately got to work trying to understand why my new attacker worked so well.
As it turned out, the picture was complicated, but one thing was clear: machine learning models need to be used carefully.</p>

<p>This would become the biggest lesson of our eventual research paper: in a machine-learning-assisted side-channel attack such as this one, if a model can reliably predict user activity, it proves the <em>presence</em> of a signal, but not the <em>cause</em> of that signal.<sup><a href="#fn7" id="ref7">7</a></sup>
Even though Shusterman et al.’s model could identify the correct victim website 91.4% of the time, that didn’t necessarily mean that their model was picking up on contention over the CPU cache.
And the implications of getting this wrong can be big: researchers look at papers describing attacks when building defenses that make our computers safer.
A more thorough analysis was needed in order to properly identify the side channel, which we set out to provide.</p>

<p>We started by replicating the larger experiments from Shusterman et al.’s paper to understand the similarities and differences between our counting-based attacker and their cache-based attacker.
It turned out that when asked to identify the correct victim website out of 100, my counting-based attacker achieved higher accuracy in nearly every experimental configuration we tried.</p>

<figure class="whitebg">
  <div class="table-container">
    <table>
      <thead>
        <tr>
          <th style="text-align: left">Web Browser</th>
          <th style="text-align: left">Operating System</th>
          <th style="text-align: right">Cache Attack</th>
          <th style="text-align: right"><strong>Counting Attack</strong></th>
        </tr>
      </thead>
      <tbody>
        <tr>
          <td style="text-align: left">Chrome</td>
          <td style="text-align: left">Linux</td>
          <td style="text-align: right">91.4% ± 1.2%</td>
          <td style="text-align: right"><strong>96.6%</strong> ± 0.8%</td>
        </tr>
        <tr>
          <td style="text-align: left">Chrome</td>
          <td style="text-align: left">Windows</td>
          <td style="text-align: right">80.0% ± 1.6%</td>
          <td style="text-align: right"><strong>92.5%</strong> ± 1.0%</td>
        </tr>
        <tr>
          <td style="text-align: left">Firefox</td>
          <td style="text-align: left">Linux</td>
          <td style="text-align: right">80.0% ± 0.6%</td>
          <td style="text-align: right"><strong>95.3%</strong> ± 0.7%</td>
        </tr>
        <tr>
          <td style="text-align: left">Firefox</td>
          <td style="text-align: left">Windows</td>
          <td style="text-align: right">87.7% ± 0.8%</td>
          <td style="text-align: right"><strong>91.9%</strong> ± 1.2%</td>
        </tr>
        <tr>
          <td style="text-align: left">Safari</td>
          <td style="text-align: left">macOS</td>
          <td style="text-align: right">72.6% ± 1.3%</td>
          <td style="text-align: right"><strong>96.6%</strong> ± 0.5%</td>
        </tr>
        <tr>
          <td style="text-align: left">Tor Browser</td>
          <td style="text-align: left">Linux</td>
          <td style="text-align: right">46.7% ± 4.1%</td>
          <td style="text-align: right"><strong>49.8%</strong> ± 4.2%</td>
        </tr>
      </tbody>
    </table>
  </div>
  <figcaption>A simplified version of Table 1 from our paper, Cook et al., 2022.<sup><a href="#fn8" id="ref8">8</a></sup></figcaption>
</figure>

<p>For some configurations in particular, this discrepancy in performance was huge: in Safari on macOS, the cache attack achieved just 72.6% accuracy, while our counting attack achieved 96.6% accuracy on the same task.
These results really seemed to suggest that the cache may have been interfering with our signal rather than helping it!
But again, we couldn’t say this for sure without a more thorough analysis.
So over the next several weeks we applied the scientific method, modifying one variable at a time, collecting new data, and training new models to eliminate different hypotheses about what was going on.
First, we established a baseline, where we simply ran the attacker in its default configuration without any modifications, and found that we could identify the correct website out of 100 with 95.2% accuracy.</p>

<h3 id="hypothesis-1-cpu-frequency-scaling">Hypothesis 1: CPU frequency scaling</h3>

<p>We then tested our first hypothesis, which was that our counting-based attack was taking advantage of a CPU-frequency-scaling side channel.
CPUs operate at a set frequency, which reflects the amount of work they can do per second.
For example, <cpu data-value="name" data-prefix="your " data-suffix=" operates ">a typical CPU might operate</cpu> at <cpu data-value="frequency">3.0 GHz</cpu>, meaning it completes about <cpu data-value="frequency-math">3 &times; 10<sup>9</sup> cycles</cpu> per second.
However, modern CPUs adjust this frequency based on the workload demanded of them, speeding up when there’s more work to do, and slowing down when there’s less, in order to save energy.<sup><a href="#fn9" id="ref9">9</a></sup>
This is why your computer might get hot or turn on a fan when you have a lot of applications open: when your CPU scales its frequency up, it performs more operations in a fixed amount of time, generating more heat due to the increased electrical activity.</p>

<p>We hypothesized that while the victim website is loading, the CPU would change its frequency often, enabling it to complete variable amounts of work over time.
And for our attacker, completing more work should enable it to count faster, yielding higher values at specific points in time while the other website loads, or vice versa.
But it turned out this wasn’t the case: we went into <a href="https://en.wikipedia.org/wiki/BIOS" target="\_blank">BIOS</a>, disabled frequency scaling, collected more data, and trained another model.
Compared to the baseline experiment, our accuracy dropped by just one point to 94.2%, indicating that changes in counter values can’t really be explained by changes in CPU frequency.
We started filling out a table to keep track of our results:</p>

<figure class="whitebg evenlesswidth">
  <div class="table-container">
    <table>
      <thead>
        <tr>
          <th style="text-align: left">Isolation Mechanism</th>
          <th style="text-align: right">Accuracy</th>
        </tr>
      </thead>
      <tbody>
        <tr>
          <td style="text-align: left">Default</td>
          <td style="text-align: right">95.2%</td>
        </tr>
        <tr>
          <td style="text-align: left"><strong>+ Disable CPU frequency scaling</strong></td>
          <td style="text-align: right"><strong>94.2%</strong></td>
        </tr>
      </tbody>
    </table>
  </div>
</figure>

<h3 id="hypothesis-2-cpu-core-contention">Hypothesis 2: CPU core contention</h3>

<p>Next, we thought our counting-based attack might have been exploiting a CPU-core-contention side channel.
Your <cpu data-value="name">CPU</cpu> has <cpu data-value="cores">several</cpu> cores, <cpu data-hideifselected="true">often around 4 or 8, </cpu>each of which can execute a fixed number of instructions per second.
However, there are generally more than <cpu data-value="cores">4 or 8</cpu> processes running on your computer, which inevitably means that some processes will have to run on the same core and compete for time.
If the attacker and victim were, by chance, scheduled on the same core, the attacker’s counter values should decrease when the victim tab spends more time loading, providing enough of a signal to tell victim websites apart.</p>

<p>But this was also wrong.
With CPU frequency scaling still disabled, we ran an experiment with Linux’s <code class="language-plaintext highlighter-rouge">taskset</code> command, which can be used to force a process to execute on a specific CPU core, and ensured that the attacker and victim tabs ran on separate cores.
Even when the attacker and victim were isolated in this way, the attacker still seemed to have plenty of information: it could still pick the correct victim website out of 100 with 94.0% accuracy.</p>

<figure class="whitebg evenlesswidth">
  <div class="table-container">
    <table>
      <thead>
        <tr>
          <th style="text-align: left">Isolation Mechanism</th>
          <th style="text-align: right">Accuracy</th>
        </tr>
      </thead>
      <tbody>
        <tr>
          <td style="text-align: left">Default</td>
          <td style="text-align: right">95.2%</td>
        </tr>
        <tr>
          <td style="text-align: left">+ Disable CPU frequency scaling</td>
          <td style="text-align: right">94.2%</td>
        </tr>
        <tr>
          <td style="text-align: left"><strong>+ Pin attacker and victim to separate cores</strong></td>
          <td style="text-align: right"><strong>94.0%</strong></td>
        </tr>
      </tbody>
    </table>
  </div>
</figure>

<p>At this point, we were a little stumped.
CPU caches, frequency, and core resource contention are relatively well-studied side channels, and we had already ruled out all three of them.
We sent out some emails and gave presentations within the department to see if anyone had ideas.
Fortunately, <a href="https://www.fintelia.io/" target="\_blank">Jonathan Behrens</a> answered our call.</p>

<h3 id="hypothesis-3-system-interrupts">Hypothesis 3: System interrupts</h3>

<p>After some further discussion, we hypothesized that our counting-based attacker might be exploiting a system-interrupt-based side channel.
This idea was a bit out of left field: we couldn’t find any prior research that had studied the security properties of system interrupts.
In hindsight, this is a little surprising considering how pervasive they are: your operating system uses system interrupts constantly to communicate with hardware devices, such as your keyboard, mouse, and display.</p>

<p>Compared to software, hardware is fairly unpredictable: anything can happen at any moment.
For example, your operating system has no idea when you’re next going to hit a key on your keyboard.
But once you do, your operating system needs to act as quickly as possible.
It generates a <em>system interrupt</em>, which it dispatches to one of your <cpu data-value="cores" data-suffix=" "></cpu>CPU cores.
Then, once the interrupt arrives at the core, any program currently executing on that core is halted immediately in order to process the interrupt.</p>

<figure class="whitebg">
  <img src="/img/blog/bigger-fish/cook-fig1.png" />
  <figcaption class="top-padding">Figure 1 from our paper. As soon as an interrupt is received on the same core as the attacker, the attacker is halted until the interrupt has been processed.</figcaption>
</figure>

<p>
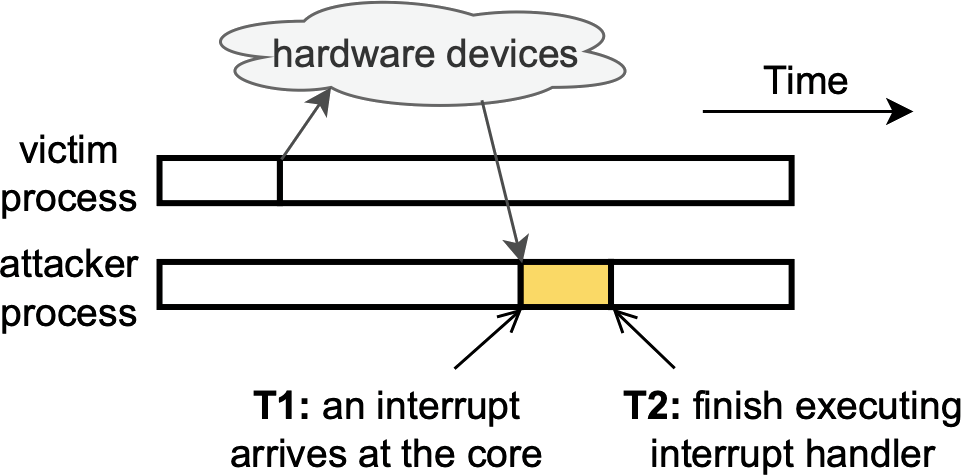
We thought that while the victim tab was loading, it would trigger many different kinds of interrupts: from your network card as it uploads and downloads data, from your graphics card as it renders content on your screen, and so on and so forth.
If any of these interrupts is processed on the same CPU core as the attacker program, your operating system would need to halt the attacker each time, preventing it from counting until each interrupt handler (shown above in yellow) has finished processing.
And remember, in the demo from earlier, we learned that less time spent counting leads to lower counter values, which can be highly indicative of activity happening elsewhere on your computer.</p>

<figure class="lesswidth whitebg">
  <img src="/img/blog/bigger-fish/cook-fig3.png" />
  <figcaption class="top-padding">Figure 3 from our paper. Even relatively small changes in counter values can reveal the victim website!</figcaption>
</figure>

<p>It turns out that on Linux, where we were running these experiments, you can monitor system interrupts very easily.
For example, if you run <code class="language-plaintext highlighter-rouge">cat /proc/interrupts</code> on Ubuntu, you should get a readout that resembles the table below:</p>

<figure class="whitebg fullwidth">
  <div class="table-container">
    <table>
      <thead>
        <tr class="thick-border">
          <th style="text-align: right">ID</th>
          <th style="text-align: left">Interrupt Type</th>
          <th style="text-align: right">Core 1</th>
          <th style="text-align: right">Core 2</th>
          <th style="text-align: right">Core 3</th>
          <th style="text-align: right">Core 4</th>
        </tr>
      </thead>
      <tbody>
        <tr>
          <td style="text-align: right"><code>16</code></td>
          <td style="text-align: left"><code>usb1</code> (Mouse)</td>
          <td style="text-align: right">31</td>
          <td style="text-align: right">0</td>
          <td style="text-align: right">0</td>
          <td style="text-align: right">0</td>
        </tr>
        <tr>
          <td style="text-align: right"><code>23</code></td>
          <td style="text-align: left"><code>usb2</code> (Keyboard)</td>
          <td style="text-align: right">1943</td>
          <td style="text-align: right">934</td>
          <td style="text-align: right">0</td>
          <td style="text-align: right">0</td>
        </tr>
        <tr>
          <td style="text-align: right"><code>27</code></td>
          <td style="text-align: left"><code>enp2s0</code> (Network card)</td>
          <td style="text-align: right">0</td>
          <td style="text-align: right">376</td>
          <td style="text-align: right">0</td>
          <td style="text-align: right">10880</td>
        </tr>
        <tr>
          <td style="text-align: right"><code>28</code></td>
          <td style="text-align: left"><code>ahci</code> (SATA/hard drive)</td>
          <td style="text-align: right">8201</td>
          <td style="text-align: right">0</td>
          <td style="text-align: right">11531</td>
          <td style="text-align: right">0</td>
        </tr>
        <tr class="thick-border">
          <td style="text-align: right"><code>30</code></td>
          <td style="text-align: left"><code>i915</code> (Graphics card)</td>
          <td style="text-align: right">0</td>
          <td style="text-align: right">193</td>
          <td style="text-align: right">0</td>
          <td style="text-align: right">364</td>
        </tr>
        <tr>
          <td style="text-align: right"><code>NMI</code></td>
          <td style="text-align: left">Local timer interrupts</td>
          <td style="text-align: right">22059</td>
          <td style="text-align: right">18076</td>
          <td style="text-align: right">19010</td>
          <td style="text-align: right">27837</td>
        </tr>
        <tr>
          <td style="text-align: right"><code>IWI</code></td>
          <td style="text-align: left">IRQ work interrupts</td>
          <td style="text-align: right">5794</td>
          <td style="text-align: right">4910</td>
          <td style="text-align: right">4950</td>
          <td style="text-align: right">7493</td>
        </tr>
        <tr>
          <td style="text-align: right"><code>RES</code></td>
          <td style="text-align: left">Rescheduling interrupts</td>
          <td style="text-align: right">1400</td>
          <td style="text-align: right">1339</td>
          <td style="text-align: right">1359</td>
          <td style="text-align: right">1262</td>
        </tr>
        <tr>
          <td style="text-align: right"><code>CAL</code></td>
          <td style="text-align: left">Function call interrupts</td>
          <td style="text-align: right">6122</td>
          <td style="text-align: right">6547</td>
          <td style="text-align: right">6563</td>
          <td style="text-align: right">3100</td>
        </tr>
        <tr class="thick-border">
          <td style="text-align: right"><code>TLB</code></td>
          <td style="text-align: left">TLB shootdowns</td>
          <td style="text-align: right">295</td>
          <td style="text-align: right">377</td>
          <td style="text-align: right">285</td>
          <td style="text-align: right">290</td>
        </tr>
      </tbody>
    </table>
  </div>
  <figcaption>Each row indicates a different kind of interrupt, and each column indicates the number of times that interrupt has been executed on each core since the computer started up. See a screenshot of the full readout <a href="/img/blog/bigger-fish/proc-interrupts.png" target="_blank">here</a> for more detail.</figcaption>
</figure>

<p>This table shows that many interrupts are being processed on all four cores, very likely interfering with the attacker’s counting!
So naturally, the next experiment we would like to run should isolate the attacker from these interrupts, letting the attacker count freely on one core while interrupts are processed on another core.
But after doing some research, we came across a problem.</p>

<p>Linux provides a mechanism to route certain types of interrupts, which we call <em>movable interrupts</em>, to a specific core.
These interrupts have numeric IDs in the table above, and generally come from external hardware devices, such as your keyboard and network card.
However, there are also many types of <em>non-movable interrupts</em> which can’t be routed to a specific core, meaning we can’t isolate them from the attacker.
These interrupts have three-letter IDs in the table above, and are generally used to synchronize activity between your CPU cores, which is why modern operating systems require that they be processed on all of them.
And unfortunately for us, as you can see in the table above, these non-movable interrupts make up the bulk of interrupt activity.</p>

<p>But we didn’t let this deter us.
We used Linux’s <code class="language-plaintext highlighter-rouge">irqbalance</code> command, which can be used to force certain interrupts to be processed on a specific CPU core, and routed all movable interrupts to core 1.
Building on the previous experiments, we additionally used <code class="language-plaintext highlighter-rouge">taskset</code> to force the attacker and victim to run on cores 2 and 3, while also forcing the CPU to run at a fixed frequency as we described earlier.
Even though we could only isolate movable interrupts, it seemed like we were onto something: the attacker’s accuracy dropped by nearly six points!</p>

<figure class="whitebg evenlesswidth">
  <div class="table-container">
    <table>
      <thead>
        <tr>
          <th style="text-align: left">Isolation Mechanism</th>
          <th style="text-align: right">Accuracy</th>
        </tr>
      </thead>
      <tbody>
        <tr>
          <td style="text-align: left">Default</td>
          <td style="text-align: right">95.2%</td>
        </tr>
        <tr>
          <td style="text-align: left">+ Disable CPU frequency scaling</td>
          <td style="text-align: right">94.2%</td>
        </tr>
        <tr>
          <td style="text-align: left">+ Pin attacker and victim to separate cores</td>
          <td style="text-align: right">94.0%</td>
        </tr>
        <tr>
          <td style="text-align: left"><strong>+ Isolate movable interrupts</strong></td>
          <td style="text-align: right"><strong>88.2%</strong></td>
        </tr>
      </tbody>
    </table>
  </div>
  <figcaption>Most of Table 3 from our paper</figcaption>
</figure>

<h3 id="hypothesis-35-non-movable-system-interrupts">Hypothesis 3.5: Non-movable system interrupts</h3>

<p>Of course, this result left us wondering what the attacker’s accuracy would be if we could isolate non-movable interrupts as well.
But again, this type of experiment is impossible: due to fundamental limitations of how operating systems are built, non-movable interrupts must be processed on every core.
If we wanted to understand the impact of these interrupts, we had to use a different approach.</p>

<p>This was where Jonathan’s expertise proved crucial: he suggested we use <a href="https://en.wikipedia.org/wiki/EBPF" target="\_blank">eBPF</a>, a low-level technology that can be used to make small changes to your operating system while it’s still running.
Among the many APIs it provides, eBPF enabled us to record two crucial things:</p>

<ul>
  <li>Every time the attacker program starts and stops</li>
  <li>Every time an interrupt handler starts and stops</li>
</ul>

<p>Remember, CPU frequency scaling is still disabled, meaning that the CPU executes a fixed number of instructions per second.
In theory, this means that if the attacker is uninterrupted, it should always be able to reach the same counter value in a fixed amount of time.
We figured that if we could record every time interval during which the attacker was interrupted, whether to run another program, to process an interrupt, or for some other unknown reason, we could compare this to every interval during which an interrupt was processed, and see if these explained the gaps in the attacker’s execution.</p>

<p>Jonathan <a href="https://github.com/jackcook/bigger-fish/blob/main/ebpf/src/main.rs" target="\_blank">wrote the code</a> to do this with eBPF, recording hundreds of these timestamps while our attacker counted away.
If we go back to the figure from earlier, we measured all of these yellow regions, during which the attacker was interrupted:</p>

<figure class="whitebg">
  <img src="/img/blog/bigger-fish/cook-fig1.png" />
  <figcaption class="top-padding">Still figure 1 from our paper</figcaption>
</figure>

<p>We analyzed these gaps in the attacker’s execution, hoping to get an understanding of what was going on, and it turned out that our intuition was right.
Out of all of these gaps that last at least 100 nanoseconds, we found that over 99% of them are spent processing interrupts!
This was the smoking gun we had been looking for all along!</p>

<p>
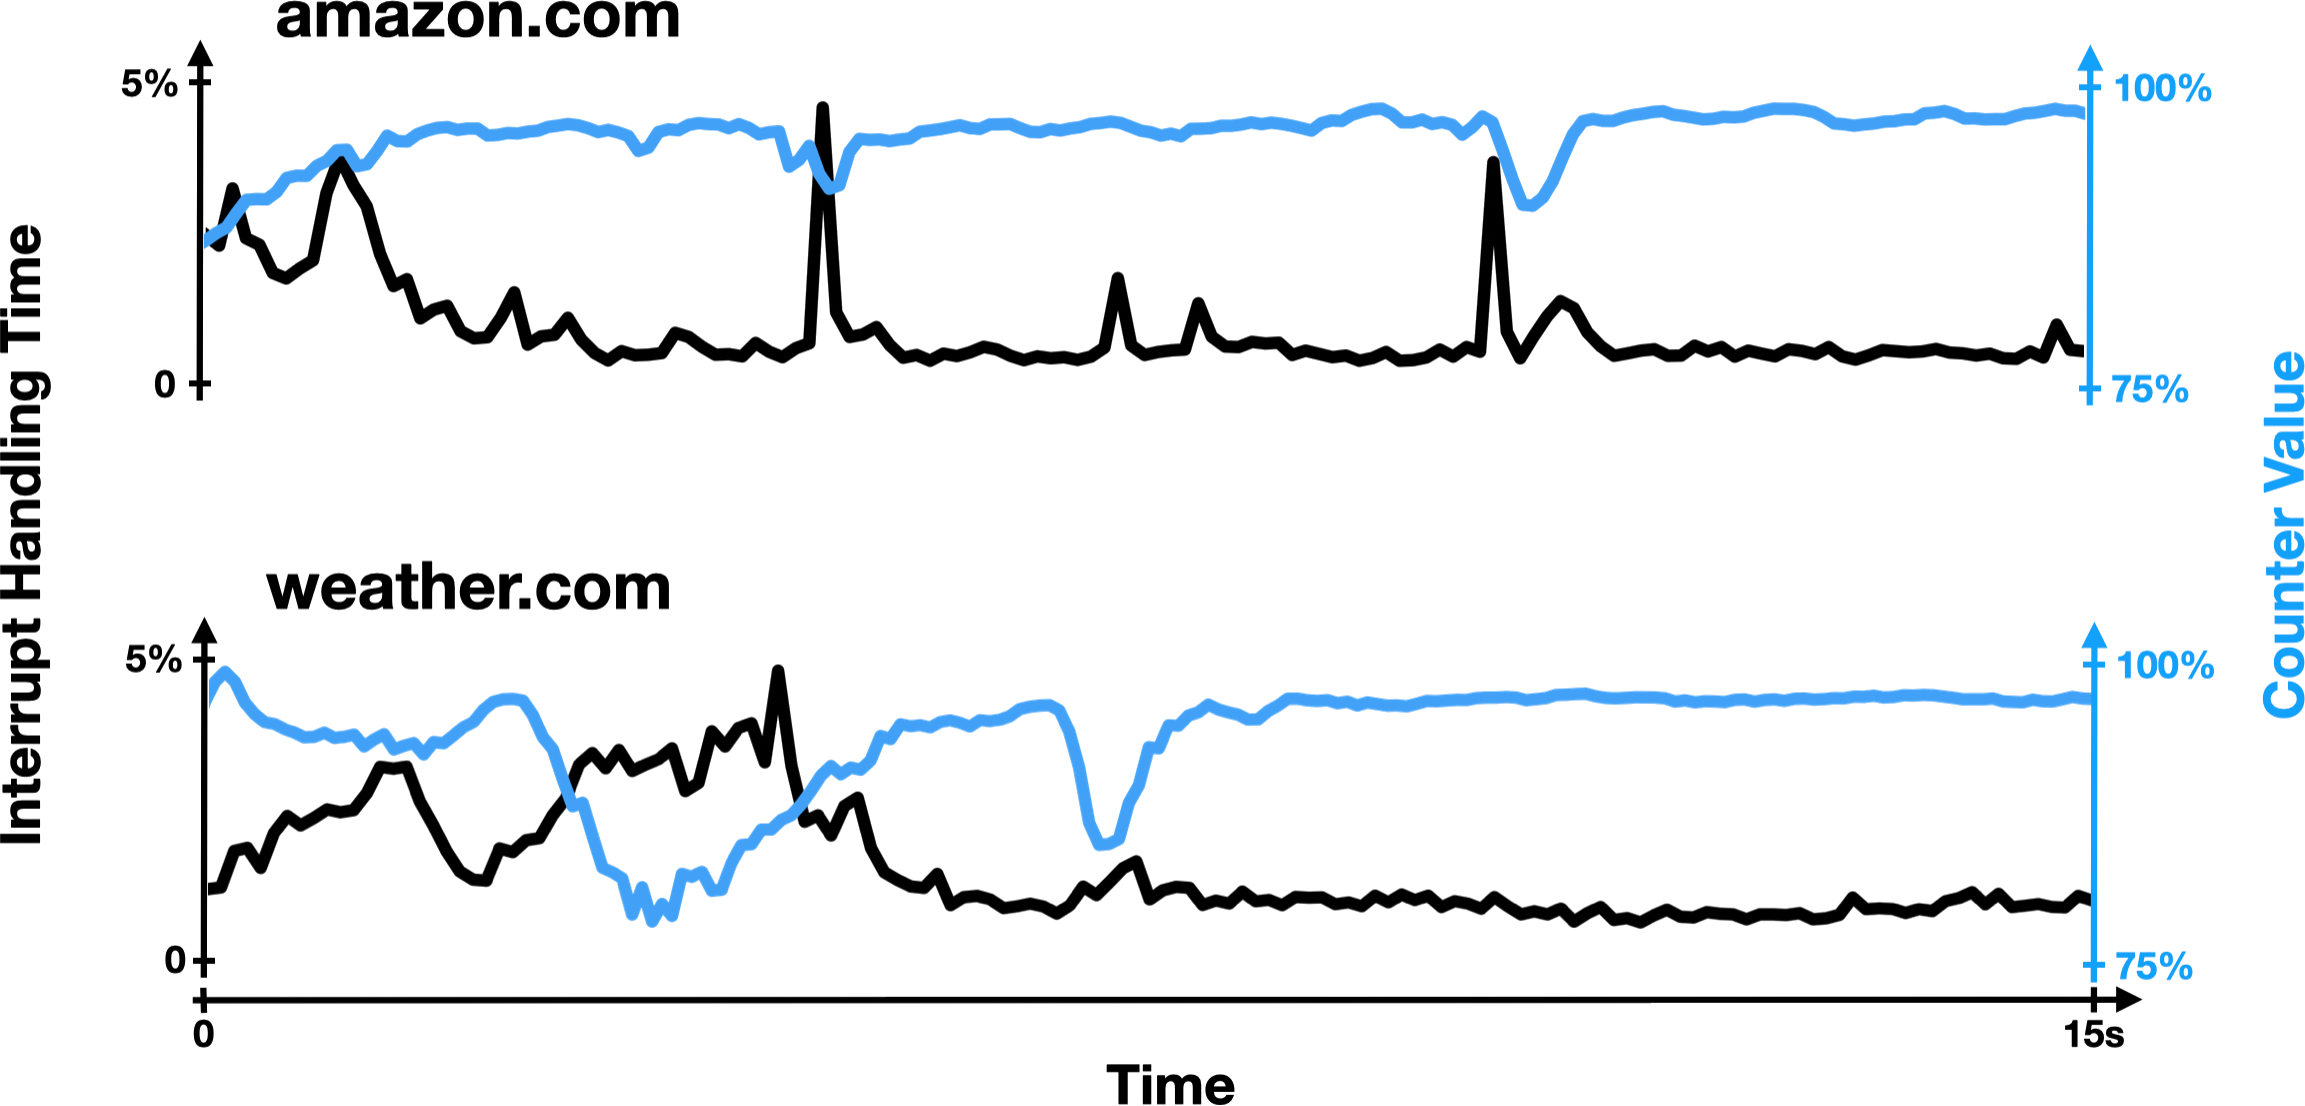
Essentially, during our experiments, the attacker’s CPU core is basically only ever doing one of two things: processing the attacker’s counting code, or processing an interrupt.
And since the CPU is running at a fixed speed, the amount of time spent processing the attacker’s code should be proportional to the number of times it’s able to increment its counter.
In the figure below, you can see this for yourself: while loading a victim website, the attacker’s counter value generally goes up when less time is spent processing interrupts, and vice versa.</p>

<figure class="whitebg fullwidth">
  <img src="/img/blog/bigger-fish/interrupt-handling-time.png" />
  <figcaption class="top-padding">A figure from our ISCA talk, showing that time spent handling interrupts time and counter values are inversely correlated.</figcaption>
</figure>

<p>Now that you understand what’s going on, I encourage you to try this demo again, seeing what happens if you do something in the middle of trace collection that triggers a bunch of interrupts.
Some suggestions include opening a new tab, pressing a bunch of buttons on your keyboard, moving your mouse around really quickly, or opening an application.</p>

<figure class="fullwidth whitebg">
  <div class="demo" data-periodlength="100" data-tracelength="10000" data-smallscreenperiodlength="200" data-showvalues="false" data-formattooltip="false"></div>
</figure>

<p>You can also try our online demo <a href="https://jackcook.github.io/bigger-fish" target="\_blank">here</a>, or check out our trace collection code <a href="https://github.com/jackcook/bigger-fish" target="\_blank">on GitHub</a>!</p>

<h2 id="theres-always-a-bigger-fish">
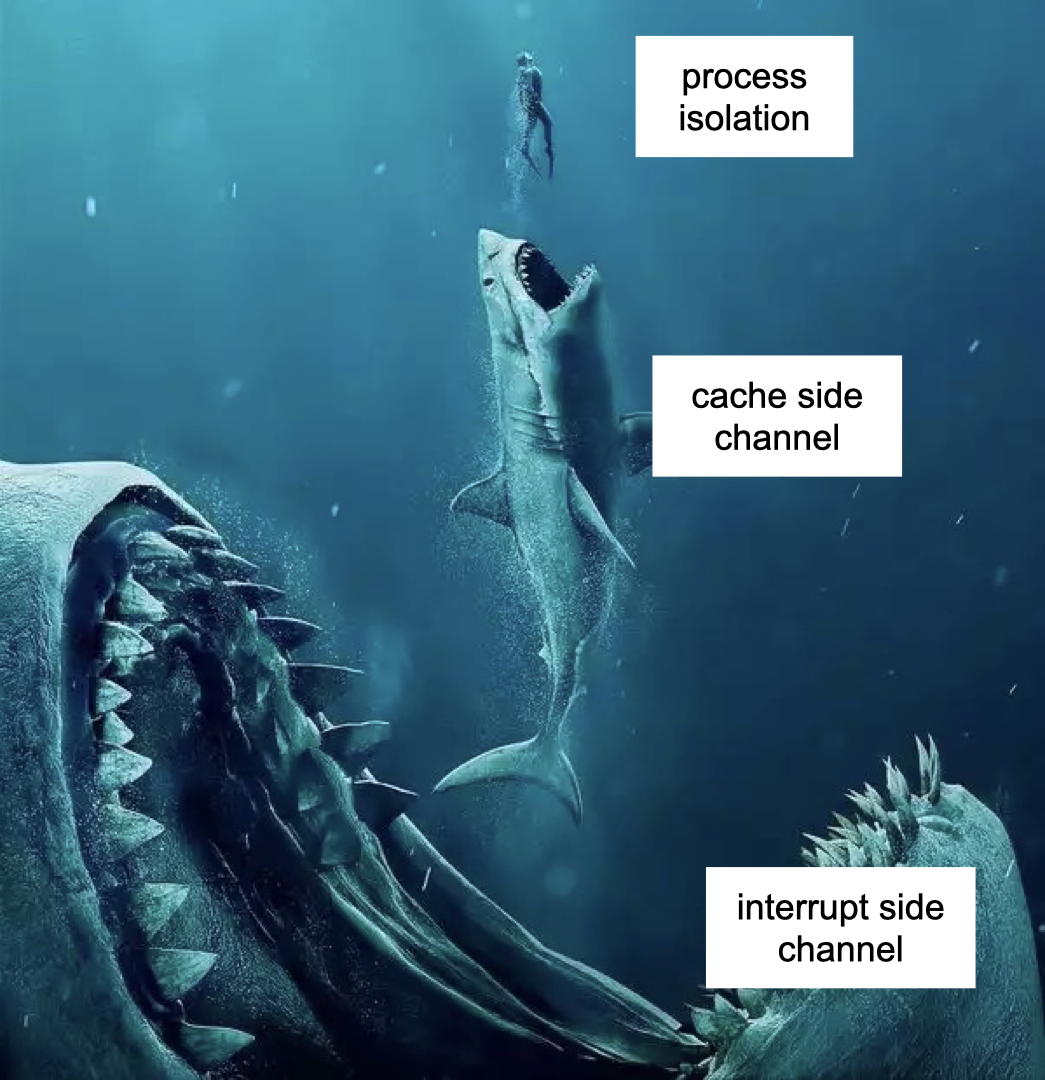
There’s always a bigger fish</h2>

<p>That was a lot!
My apologies if I lost you in some of the technical details.
Let me take a step back and summarize what we did one more time:</p>

<ul>
  <li>We re-implemented a state-of-the-art cache-based website fingerprinting attack</li>
  <li>We modified it to remove cache accesses, yielding a new counting-based attacker which took advantage of some unknown side channel</li>
  <li>We ruled out several possible side channels, including CPU caches, CPU frequency, and CPU core contention</li>
  <li>We used eBPF to prove that this attack primarily leverages a system-interrupt-based side channel</li>
</ul>

<p>And through this process, we came away with two key findings:</p>

<h3 id="1-system-interrupts-leak-user-activity">1. System interrupts leak user activity</h3>

<p>This was a fairly surprising finding: the security properties of system interrupts had never been demonstrated before.
We became the first group to study this new system-interrupt-based side channel, and we likely won’t be the last: there are tons of directions for future work!
I’ll come back to this in a moment.</p>

<h3 id="2-machine-learning-assisted-side-channel-attacks-need-to-be-analyzed-carefully">2. Machine-learning-assisted side-channel attacks need to be analyzed carefully</h3>

<p>This is arguably our most important takeaway, and almost certainly the reason we ended up winning those awards from Intel and IEEE.
Machine learning models are great at finding patterns in data and can be used regardless of one’s understanding of the side channel being attacked, which leads to the development of powerful attacks that are poorly understood.</p>

<p>Without instrumenting our operating system, we could not have made many conclusions about which side channel our attack was exploiting: it’s impossible to do this with models that can only find correlations!
And it’s important to get this right—an incorrect analysis of an attack can mislead researchers hoping to build defenses, wasting valuable time and energy.</p>

<p>For example, in their paper, Shusterman et al. proposed a defense against their attack that involves repeatedly evicting data from the CPU cache while the attacker tries to collect data.
The idea was driven by their understanding of the side channel being exploited: adding noise to the CPU cache should make it more difficult to exploit a cache-based side channel.
However, we found that a defense that instead generates a bunch of interrupts, such as by making network requests to local IP addresses, defends significantly better against both the cache-based attack and our counting-based attack!</p>

<figure class="whitebg lesswidth">
  <div class="table-container">
    <table>
      <thead>
        <tr>
          <th style="text-align: left">Attack</th>
          <th style="text-align: right">Baseline</th>
          <th style="text-align: right">With Cache Noise</th>
          <th style="text-align: right">With Interrupt Noise</th>
        </tr>
      </thead>
      <tbody>
        <tr>
          <td style="text-align: left">Counting Attack (ours)</td>
          <td style="text-align: right">95.7%</td>
          <td style="text-align: right">92.6%</td>
          <td style="text-align: right">62.0%</td>
        </tr>
        <tr>
          <td style="text-align: left">Cache Attack (Shusterman et al.)</td>
          <td style="text-align: right">78.4%</td>
          <td style="text-align: right">76.2%</td>
          <td style="text-align: right">55.3%</td>
        </tr>
      </tbody>
    </table>
  </div>
  <figcaption>Table 2 from our paper, which shows that both attacks are affected more by extra interrupts than by extra cache accesses.</figcaption>
</figure>

<p>This is a relatively simple example, but it shows how having a better understanding of the side channel being exploited can increase our ability to defend against it.
In combination with our other findings, it also helped us build our case that Shusterman et al.’s attack primarily exploits signals from interrupts, and not the cache.
We hope this work motivates future researchers to apply these models carefully.</p>

<figure class="whitebg">
  <img src="/img/blog/bigger-fish/bigger-fish.png" />
  <figcaption>There’s Always a Bigger Fish</figcaption>
</figure>

<h3 id="other-findings">Other findings</h3>

<p>There are a few more interesting findings in <a href="https://dl.acm.org/doi/pdf/10.1145/3470496.3527416" target="\_blank">our paper</a> if you’re curious to keep reading!
A couple of these include:</p>

<ul>
  <li>We proposed a modification to the clock provided to JavaScript code that completely mitigates our attack</li>
  <li>We ran experiments that isolated the attacker and victim by putting them in separate virtual machines, which should theoretically offer the most isolation possible</li>
  <li>We discussed and analyzed the properties of several types of non-movable interrupts, including how frequently some of them fire and exactly how long they take to process</li>
</ul>

<p>And more! Unfortunately this blogpost is already long enough as it is.</p>

<h2 id="future-work">Future work</h2>

<p>There are a bunch of open questions in this area, even today, two years after we originally published this paper.
Here are a few that are still at the top of my mind.
If you find any of these interesting, please get in touch!</p>

<h3 id="how-should-we-rethink-interrupts">How should we rethink interrupts?</h3>

<p>Similarly to <a href="https://meltdownattack.com" target="\_blank">Spectre and Meltdown</a>, our attack targets hardware mechanisms that are embedded deep inside basically all modern computers.
It’s currently impossible to implement a defense that isolates non-movable interrupts from an attacker, and it’s unclear how computers would be redesigned in a way that makes that possible.
Figuring this out presents an important direction for future research, especially if attacks such as ours become more accurate in the future.</p>

<h3 id="the-relationship-between-websites-and-interrupts-is-not-well-understood">The relationship between websites and interrupts is not well understood</h3>

<p>Below, you can see a figure from our paper, in which we show how interrupt handling time varies while loading three different websites.
Notice that the behavior, and even the types of interrupts, are different: loading weather.com triggers a lot of rescheduling interrupts, but nytimes.com and amazon.com don’t trigger any!</p>

<figure class="whitebg">
  <img src="/img/blog/bigger-fish/cook-fig5.png" />
  <figcaption>Figure 5 from our paper</figcaption>
</figure>

<p>
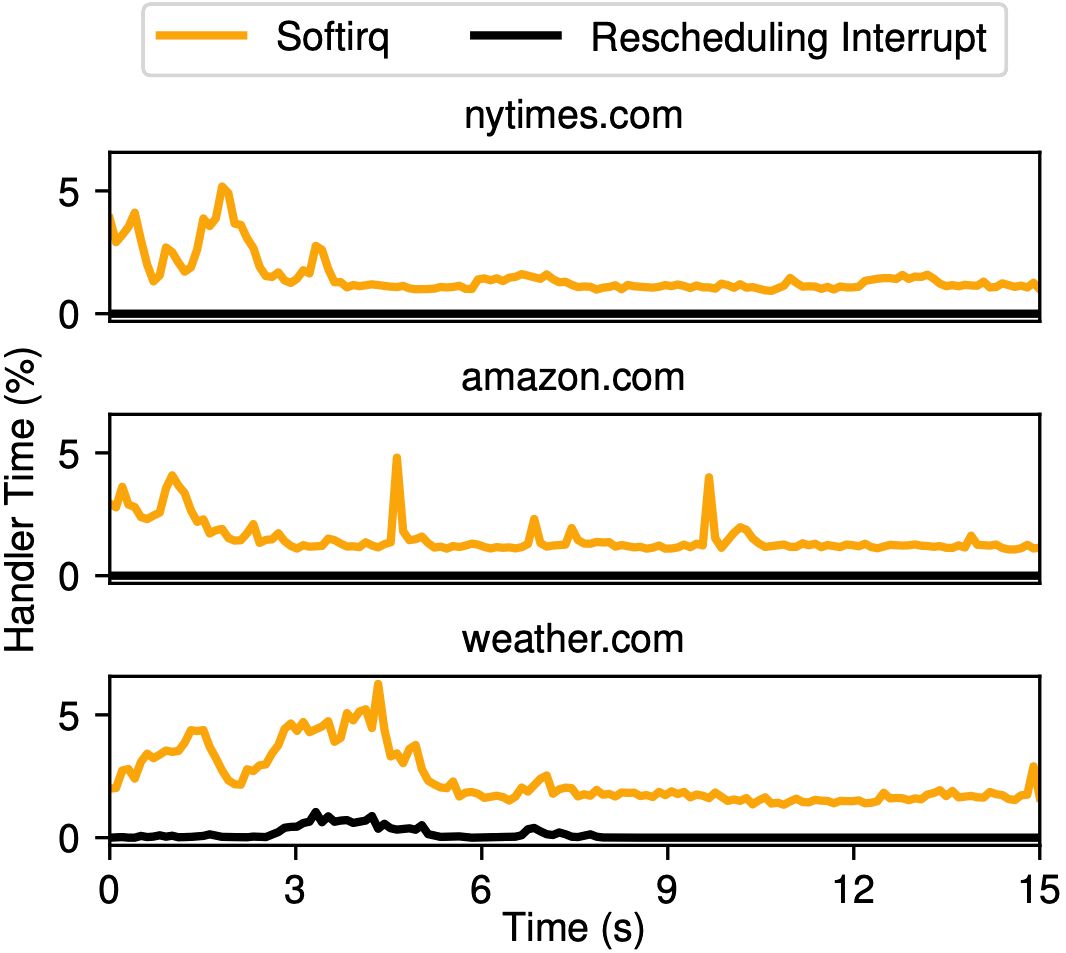
We don’t know why this is: clearly, there is something that weather.com is doing, perhaps loading more video content or more scripts or something, that the other two websites are not.
At a more basic level, we’re not really sure what the relationship is between website activity and triggered interrupts.
What impact does loading one additional image have on the attacker’s counter trace?
What about an advertisement?
What is it exactly that makes the counter traces so distinctive that we can tell them apart so easily?
We didn’t spend time trying to answer these questions, but a better understanding of this relationship would likely help us build better defenses against system-interrupt-based side-channel attacks such as ours.</p>

<h3 id="the-attack-could-be-made-stronger">The attack could be made stronger</h3>

<p>We wrote this paper as more of an “analysis paper,” and not as an “attack paper.”
In theory, the 96.6% accuracy that we achieved when identifying the victim website in Chrome on Linux is a lower bound, not an upper bound.
It’s pretty likely that a better model, or a different methodology, could achieve higher accuracy.
And if it’s possible to achieve higher accuracy on this 100-website task, it’s likely possible to perform well on a 1,000-website task, or on some other privacy-compromising task: figuring out what movie you’re watching, or whether you’re using a VPN, or how often you check Robinhood.</p>

<h3 id="browser-based-defenses-could-be-made-stronger">Browser-based defenses could be made stronger</h3>

<p>All browsers reduce the precision of the clock that they provide to websites via JavaScript: instead of telling you it’s 10:33:13.726142 (13.726142 seconds after the clock strikes 10:33am), your browser might just round to the nearest millisecond and tell you it’s 10:33:13.726.
This is because with access to higher-precision timers, attacks such as ours become much more accurate (see <a href="https://arxiv.org/abs/1502.07373" target="\_blank">Oren et al., 2015</a>).</p>

<p>As a result, Chrome rounds its clock to the nearest 0.1 millisecond and adds some random noise, while Firefox and Safari round to the nearest 1 millisecond.
<a href="https://www.torproject.org/download/" target="\_blank">Tor Browser</a>, the world’s most popular secure web browser, rounds to the nearest 100 milliseconds, reducing our attack’s accuracy from 96.6% (in Chrome) to 49.8%.
There is a tradeoff here: browser-based game engines, for example, need a high-precision timer in order to render and animate content correctly.
As a result, Tor Browser users are unable to play most games, but this is not necessarily a problem for users who care about security.</p>

<p>In Section 6.1 of <a href="https://dl.acm.org/doi/10.1145/3470496.3527416" target="\_blank">our paper</a>, we propose a slight modification to browser clocks that completely mitigates our attack.
I think it’s a step in the right direction, but more work needs to be done to implement this defense into real web browsers, and to examine whether it’s practical for most users.</p>

<h2 id="how-this-paper-changed-my-life">How this paper changed my life</h2>

<p>Before taking Mengjia’s class, the thought of going to graduate school had crossed my mind, but it was not an option I was taking seriously.
One year prior, I had worked at NVIDIA as a deep learning research intern, and I loved it.
After graduating, I probably would have looked for a full-time job there, or at another big tech company, or at some AI startup.</p>

<p>But this project showed me that research can be fun, and maybe even beautiful.
It was a result of myself and three talented researchers coming together, each with a different background and skillset, to learn and create new knowledge together.
This realization changed my life: after graduating from MIT with this paper under my belt, I stuck around for another year to earn my MEng in computer science, which I would not have done if not for this project.
I then applied for a Rhodes scholarship, which I absolutely would not have won had it not been for this project, and which enabled me to spend two years studying at the University of Oxford.
Next year, I will start my six-year PhD in computer science back at MIT, and I could not be more thrilled!</p>

<p>I am grateful to Jules, Jonathan, and especially Mengjia, for making this project possible, and for taking a chance on me—I can only hope that my future research projects will be as exciting and formative as this one.</p>

<div id="mc_embed_signup">
  <form action="https://jackcook.us3.list-manage.com/subscribe/post?u=092c1ebd5c3af75029c7d88b7&amp;id=c5b12a8c85&amp;f_id=00582ee2f0" method="post" id="mc-embedded-subscribe-form" name="mc-embedded-subscribe-form" class="validate" target="_blank" novalidate="">
    <div id="mc_embed_signup_scroll" class="default">
      <div class="mc-field-group">
        <input type="email" value="" name="EMAIL" placeholder="Enter your email" class="required email" id="mce-EMAIL" />
        <div id="mce-responses" class="clear">
          <div id="mce-error-response" class="response" style="display: none"></div>
          <div id="mce-success-response" class="response" style="display: none"></div>
        </div>
      </div>
      <!-- real people should not fill this in and expect good things - do not remove this or risk form bot signups-->
      <div style="position: absolute; left: -5000px" aria-hidden="true">
        <input type="text" name="b_092c1ebd5c3af75029c7d88b7_c5b12a8c85" tabindex="-1" value="" />
      </div>
      <div class="clear">
        <input type="submit" value="Subscribe" name="subscribe" id="mc-embedded-subscribe" class="button" />
      </div>
    </div>
  </form>
</div>

<div class="acknowledgment-border"></div>
<div id="footnotes">
<sup id="fn1">1. Intel still hasn’t updated their website for some reason, but I promise we won. Source: <a href="/img/blog/bigger-fish/intel-award.jpeg" target="_blank">trust me bro</a> <a href="#ref1" title="Jump back to footnote 1 in the text.">&#8617;</a></sup>
<sup id="fn2">2. <a href="https://www.youtube.com/shorts/d_lHcJGwnxM" target="_blank">https://www.youtube.com/shorts/d_lHcJGwnxM</a> <a href="#ref2" title="Jump back to footnote 2 in the text.">&#8617;</a></sup>
<sup id="fn3"> 3. I’m just going to refer to it as the CPU cache for simplicity, but if you care about the details, we want to evict data from the last-level cache (LLC), which is the largest and slowest CPU cache. <a href="#ref3" title="Jump back to footnote 3 in the text.">&#8617;</a></sup>
<sup id="fn4">4. You don’t actually need to access every single element: accessing elements at LLC cache line-sized intervals (usually 64 bytes each) is enough to evict all of the data in that cache line. <a href="#ref4" title="Jump back to footnote 4 in the text.">&#8617;</a></sup>
<sup id="fn5">5. All browsers reduce the precision of the clock that they provide to websites via JavaScript: instead of telling you it’s 10:33:13.726142 (13.726142 seconds after the clock strikes 10:33am), your browser might just round to the nearest millisecond and tell you it’s 10:33:13.726. The reason for this is a little crazy: with a higher-precision timer, you can measure the latency of a single memory access (if it takes longer than a few nanoseconds to read an array value, the value was definitely missing from the cache), enabling you to pull off much more accurate cache-based side-channel attacks (see <a href="https://arxiv.org/abs/1502.07373" target="_blank">Oren et al., 2015</a>). All web browsers have since updated to reduce the resolution of their timers, but Chrome’s timer remains the most precise: Chrome rounds to the nearest 100 microseconds, while Firefox and Safari both round to the nearest 1 millisecond. This means that Chrome will give the most accurate timing data for the cache latency demo in this post. <a href="#ref5" title="Jump back to footnote 5 in the text.">&#8617;</a></sup>
<sup id="fn6">6. The numbers in the table are from the closed-world LSTM column in Table 2 of <a href="https://www.usenix.org/conference/usenixsecurity19/presentation/shusterman" target="_blank">Shusterman et al.’s paper</a>. They also report results for an open-world setup, in which the correct website might not be in the training data. <a href="#ref6" title="Jump back to footnote 6 in the text.">&#8617;</a></sup>
<sup id="fn7">7. Note that the inverse is not true: if a model doesn’t achieve high accuracy, it might just mean that your model isn’t good enough, not that there’s no signal. <a href="#ref7" title="Jump back to footnote 7 in the text.">&#8617;</a></sup>
<sup id="fn8">8. See footnote 6. We report open-world results in our paper as well. <a href="#ref8" title="Jump back to footnote 8 in the text.">&#8617;</a></sup>
<sup id="fn9">9. Differences in the data being processed can actually also cause CPU frequency to change! <a href="https://www.hertzbleed.com/" target="_blank">Wang et al., 2022</a> (also selected by IEEE Micro Top Picks) write, “on modern processors, the same program can run at a different CPU frequency (and therefore take a different [amount of] time) when computing, for example, 2022 + 23823 compared to 2022 + 24436.” This opens up yet another side channel. <a href="#ref9" title="Jump back to footnote 9 in the text.">&#8617;</a></sup>
</div>]]></content><author><name></name></author><summary type="html"><![CDATA[A story about side-channel attacks, computer architecture, and how I unexpectedly got my start in academia.]]></summary></entry><entry><title type="html">Mamba: The Easy Way</title><link href="https://jackcook.com/2024/02/23/mamba.html" rel="alternate" type="text/html" title="Mamba: The Easy Way" /><published>2024-02-23T00:00:00+00:00</published><updated>2024-02-23T00:00:00+00:00</updated><id>https://jackcook.com/2024/02/23/mamba</id><content type="html" xml:base="https://jackcook.com/2024/02/23/mamba.html"><![CDATA[<p>Today, basically any language model you can name is a Transformer model.
OpenAI’s <a href="https://chat.openai.com" target="\_blank">ChatGPT</a>, Google’s <a href="https://deepmind.google/technologies/gemini/" target="\_blank">Gemini</a>, and GitHub’s <a href="https://github.com/features/copilot" target="\_blank">Copilot</a> are all powered by Transformers, to name a few.
However, Transformers suffer from a fundamental flaw: they are powered by <a href="http://nlp.seas.harvard.edu/annotated-transformer/" target="\_blank">Attention</a>, which scales quadratically with sequence length.
Simply put, for quick exchanges (asking ChatGPT to tell a joke), this is fine.
But for queries that require lots of words (asking ChatGPT to summarize a 100-page document), Transformers can become prohibitively slow.<sup><a href="#fn1" id="ref1">1</a></sup></p>

<p>Many models have attempted to solve this problem, but few have done as well as <a href="https://arxiv.org/abs/2312.00752" target="\_blank">Mamba</a>.
Published two months ago by <a href="https://twitter.com/_albertgu" target="\_blank">Albert Gu</a> and <a href="https://tridao.me" target="\_blank">Tri Dao</a>, Mamba appears to outperform similarly-sized Transformers while scaling linearly with sequence length.
If you’re looking for an in-depth technical explanation of Mamba, paired with a full Triton implementation, you’re in the wrong place.
<a href="https://srush.github.io/annotated-mamba/hard.html" target="\_blank">Mamba: The Hard Way</a> has already been written by the legend himself, <a href="https://rush-nlp.com" target="\_blank">Sasha Rush</a>.
If you haven’t heard of Mamba (or Triton), or you’re looking for a higher-level overview of Mamba’s big ideas, I have just the post for you.</p>

<p>The prospect of an accurate linear-time language model has gotten many excited about the future of language model architectures (especially Sasha, who has <a href="https://www.isattentionallyouneed.com" target="\_blank">money on the line</a>).
In this blogpost, I’ll try to explain how Mamba works in a way that should be fairly straightforward, especially if you’ve studied a little computer science before.
Let’s get started!</p>

<blockquote class="twitter-tweet"><p lang="en" dir="ltr">Quadratic attention has been indispensable for information-dense modalities such as language... until now.<br /><br />Announcing Mamba: a new SSM arch. that has linear-time scaling, ultra long context, and most importantly--outperforms Transformers everywhere we&#39;ve tried.<br /><br />With <a href="https://twitter.com/tri_dao?ref_src=twsrc%5Etfw">@tri_dao</a> 1/ <a href="https://t.co/vXumZqJsdb">pic.twitter.com/vXumZqJsdb</a></p>&mdash; Albert Gu (@_albertgu) <a href="https://twitter.com/_albertgu/status/1731727672286294400?ref_src=twsrc%5Etfw">December 4, 2023</a></blockquote>
<script async="" src="https://platform.twitter.com/widgets.js" charset="utf-8"></script>

<h2 id="background-s4">Background: S4</h2>

<p>Mamba’s architecture is based primarily on <a href="https://arxiv.org/abs/2111.00396" target="\_blank">S4</a>, a recent state space model (SSM) architecture.
I’ll summarize the important parts here, but if you want to understand S4 in more detail, I would highly recommend reading another one of Sasha’s blogposts, <a href="https://srush.github.io/annotated-s4/" target="\_blank">The Annotated S4</a>.</p>

<p>At a high level, S4 learns how to map an input \(x(t)\) to an output \(y(t)\) through an intermediate state \(h(t)\).
Here, \(x\), \(y\), and \(h\) are functions of \(t\) because SSMs are designed to work well with continuous data such as audio, sensor data, and images.
S4 relates these to each other with three continuous parameter matrices \(\mathbf{A}\), \(\mathbf{B}\), and \(\mathbf{C}\).
These are all tied together through the following two equations (1a and 1b in Mamba’s paper):</p>

<p>\[\begin{align}h'(t)&amp;=\mathbf{A}h(t)+\mathbf{B}x(t)\\y(t)&amp;=\mathbf{C}h(t)\end{align}\]</p>

<p>In practice, we always deal with discrete data, such as text.
This requires us to <a href="https://en.wikipedia.org/wiki/Discretization" target="\_blank"><em>discretize</em></a> the SSM, transforming our continuous parameters \(\mathbf{A}\), \(\mathbf{B}\), \(\mathbf{C}\) into discrete parameters \(\mathbf{\bar{A}}\), \(\mathbf{\bar{B}}\), \(\mathbf{C}\) by using a special fourth parameter \(\Delta\).
I’m not going to get into the details of how discretization works here, but the authors of S4 have written a nice <a href="https://hazyresearch.stanford.edu/blog/2022-01-14-s4-3" target="\_blank">blogpost</a> about it if you’re curious.
Once discretized, we can instead represent the SSM through these two equations (2a and 2b):</p>

<p>\[\begin{align}h_t&amp;=\mathbf{\bar{A}}h_{t-1}+\mathbf{\bar{B}}x_t\\y_t&amp;=\mathbf{C}h_t\end{align}\]</p>

<p>These equations form a recurrence, similar to what you would see in a <a href="https://stanford.edu/~shervine/teaching/cs-230/cheatsheet-recurrent-neural-networks" target="\_blank">recurrent neural network</a> (RNN).
At each step \(t\), we combine the hidden state from the previous timestep \(h_{t-1}\) with the current input \(x_t\) to create the new hidden state \(h_t\).
Below, you can see how this would work when predicting the next word in a sentence (in this case, we predict that “and” follows “My name is Jack”).</p>

<figure class="lesswidth whitebg">
<img src="/img/blog/mamba/rnn.svg" />
</figure>

<!-- prettier-ignore -->
<p>In this way, we can essentially use S4 as an RNN to generate one token at a time.
However, what makes S4 really cool is that you can actually also use it as a <a href="https://stanford.edu/~shervine/teaching/cs-230/cheatsheet-convolutional-neural-networks" target="\_blank">convolutional neural network</a> (CNN).
In the above example, let’s see what happens when we expand the discrete equations from earlier to try to calculate \(h_3\).
For simplicity, let’s assume \(x_{-1}=0\).</p>

<p>\[\begin{align}h_0&amp;=\mathbf{\bar{B}}x_0\\h_1&amp;=\mathbf{\bar{A}}(\mathbf{\bar{B}}x_0)+\mathbf{\bar{B}}x_1\\h_2&amp;=\mathbf{\bar{A}}(\mathbf{\bar{A}}(\mathbf{\bar{B}}x_0)+\mathbf{\bar{B}}x_1)+\mathbf{\bar{B}}x_2\\h_3&amp;=\mathbf{\bar{A}}(\mathbf{\bar{A}}(\mathbf{\bar{A}}(\mathbf{\bar{B}}x_0)+\mathbf{\bar{B}}x_1)+\mathbf{\bar{B}}x_2)+\mathbf{\bar{B}}x_3\end{align}\]</p>

<p>With \(h_3\) calculated, we can substitute this into the equation for \(y_3\) to predict the next word.</p>

<p>\[\begin{align}y_3&amp;=\mathbf{C}(\mathbf{\bar{A}}(\mathbf{\bar{A}}(\mathbf{\bar{A}}(\mathbf{\bar{B}}x_0)+\mathbf{\bar{B}}x_1)+\mathbf{\bar{B}}x_2)+\mathbf{\bar{B}}x_3)\\y_3&amp;=\mathbf{C\bar{A}\bar{A}\bar{A}\bar{B}}x_0+\mathbf{C\bar{A}\bar{A}\bar{B}}x_1+\mathbf{C\bar{A}\bar{B}}x_2+\mathbf{C\bar{B}}x_3\end{align}\]</p>

<p>Now, notice that \(y_3\) can actually be computed as a dot product, where the right-hand vector is just our input \(x\):</p>

<p>\[y_3=\begin{pmatrix}
\mathbf{C\bar{A}\bar{A}\bar{A}\bar{B}} &amp; \mathbf{C\bar{A}\bar{A}\bar{B}} &amp; \mathbf{C\bar{A}\bar{B}} &amp; \mathbf{C\bar{B}}
\end{pmatrix}\begin{pmatrix}
x_0\\
x_1\\
x_2\\
x_3
\end{pmatrix}\]</p>

<p>Since \(\mathbf{\bar{A}}\), \(\mathbf{\bar{B}}\), and \(\mathbf{C}\) are all constant, we can precompute the left-hand vector and save it as our convolutional kernel \(\mathbf{\bar{K}}\).
This leaves us with an easy way to compute \(y\) with <a href="https://en.wikipedia.org/wiki/Convolution" target="\_blank">convolution</a>, as shown by the following two equations<sup><a href="#fn2" id="ref2">2</a></sup> (3a and 3b in Mamba’s paper):</p>

<p>\[\begin{align}\mathbf{\bar{K}}&amp;=\begin{pmatrix}\mathbf{C\bar{B}} &amp; \mathbf{C\bar{A}\bar{B}} &amp; \cdots &amp; \mathbf{C\bar{A}^k\bar{B}}\end{pmatrix}\\y&amp;=\mathbf{\bar{K}} * x\end{align}\]</p>

<p>Importantly, these recurrent and convolutional forms, which I like to call “RNN mode” and “CNN mode,” are <em>mathematically equivalent</em>.
This allows S4 to shape-shift depending on what you need it to do, with no difference in its outputs.
We can compare the differences between these “modes” in Table 1 from the S4 paper, which shows the runtime complexity of training and inference for each form (bold denotes the best result for each metric).<sup><a href="#fn3" id="ref3">3</a></sup></p>

<div class="table-scroll-container">
<table class="left-aligned">
<thead>
<tr><td></td><td>Convolution</td><td>Recurrence</td><td>S4</td></tr>
</thead>
<tbody>
<tr><td>Training</td><td>\(\boldsymbol{\tilde{L}H(B+H)}\)</td><td>\(BLH^2\)</td><td>\(\boldsymbol{BH(\tilde{H}+\tilde{L})+B\tilde{L}H}\)</td></tr>
<tr><td>Parallel</td><td><strong>Yes</strong></td><td>No</td><td><strong>Yes</strong></td></tr>
<tr><td>Inference</td><td>\(LH^2\)</td><td>\(\boldsymbol{H^2}\)</td><td>\(\boldsymbol{H^2}\)</td></tr>
</tbody>
</table>
</div>

<p>Notice that CNN mode is better for training, while RNN mode is better for inference.
In CNN mode, we can take advantage of parallelism to train across many examples, all at once.
In RNN mode, although we can only calculate one step at a time, each step requires exactly the same amount of work.
Because S4 can use both modes, it essentially gets the best of both worlds: fast training, and even faster inference.</p>

<h2 id="idea-1-selectivity">Idea #1: Selectivity</h2>

<p>Now we can move on to the first major idea introduced by Mamba: <strong>selectivity</strong>.
Let’s recall the two equations that define the discrete form of S4:</p>

<p>\[\begin{align}h_t&amp;=\mathbf{\bar{A}}h_{t-1}+\mathbf{\bar{B}}x_t\\y_t&amp;=\mathbf{C}h_t\end{align}\]</p>

<p>Note that in S4, our discrete parameters \(\mathbf{\bar{A}}\), \(\mathbf{\bar{B}}\), and \(\mathbf{C}\) are constant.
However, Mamba makes these parameters vary based on the input.
We’ll instead end up with something like this:<sup><a href="#fn4" id="ref4">4</a></sup></p>

<p>\[\begin{align}h_t&amp;=s_\mathbf{\bar{A}}(x_t)h_{t-1}+s_\mathbf{\bar{B}}(x_t)x_t\\y_t&amp;=s_\mathbf{C}(x_t)h_t\end{align}\]</p>

<p>The authors argue that selectivity, or input-dependence, is important for a number of tasks.
Here’s how I like to think about it: because S4 does not have selectivity, it is forced to treat all parts of the input exactly the same.
However, when you’re reading a sentence, some words inevitably matter more than others.
Imagine we have a model that classifies sentences based on intent, and we give it the sentence: “I want to order a hamburger.”
Without selectivity, S4 spends the same amount of “effort” processing each word.
Click on the buttons below to see what happens as the sentence is processed, one word at a time.</p>

<figure id="no-selectivity-demo" class="fullwidth whitebg">
<h3>Click on the arrows to update the hidden state</h3>
<div class="demo">
<div class="left-panel">
<div><span class="w">I</span> <span class="w">want</span> <span class="w">to</span> <span class="w">order</span> <span class="w">a</span> <span class="w">hamburger</span></div>
<div class="buttons-container">
<button class="button-6" onclick="noSelectivityDemo.removeSlice()">&larr;</button>
<button class="button-6" onclick="noSelectivityDemo.addSlice()">&rarr;</button>
</div>
</div>
<div class="right-panel">
<h4>Hidden State</h4>
<div class="pie-chart"></div>
</div>
</div>
<figcaption>(This is an oversimplification, but it should give you a sense of what’s going on.)</figcaption>
</figure>

<p>But if you were a model trying to classify the intent of this sentence, you would probably want to “focus” more on some words than others.
How much value do the words “want” and “to” really contribute to the underlying meaning of this sentence?
In reality, it would be great if we could spend more of our limited mental energy on words like “order,” to know what the user wants to do, and “hamburger,” to know what the user is ordering.
By making model parameters a function of the input, Mamba makes it possible to “focus” on the parts of the input that are more important for the task at hand.</p>

<figure id="with-selectivity-demo" class="fullwidth whitebg">
<h3>Click on the arrows to update the hidden state</h3>
<div class="demo">
<div class="left-panel">
<div><span class="w">I</span> <span class="w">want</span> <span class="w">to</span> <span class="w">order</span> <span class="w">a</span> <span class="w">hamburger</span></div>
<div class="buttons-container">
<button onclick="withSelectivityDemo.removeSlice()">&larr;</button>
<button onclick="withSelectivityDemo.addSlice()">&rarr;</button>
</div>
</div>
<div class="right-panel">
<h4>Hidden State</h4>
<div class="pie-chart"></div>
</div>
</div>
<figcaption>(Also an oversimplification.)</figcaption>
</figure>

<p>However, selectivity presents us with a problem.
Let’s think back to the convolutional kernel \(\mathbf{\bar{K}}\) that we calculated earlier.</p>

<p>\[\mathbf{\bar{K}}=\begin{pmatrix}\mathbf{C\bar{B}} &amp; \mathbf{C\bar{A}\bar{B}} &amp; \cdots &amp; \mathbf{C\bar{A}^k\bar{B}}\end{pmatrix}\]</p>

<p>In S4, we could precompute this kernel, save it, and multiply it with the input \(x\).
And this was fine, because \(\mathbf{\bar{A}}\), \(\mathbf{\bar{B}}\), and \(\mathbf{C}\) were constant.
But again, in Mamba, these matrices change depending on the input!
As a result, we can’t precompute \(\mathbf{\bar{K}}\), and we can’t use CNN mode to train our model.
If we want selectivity, we’ll need to train with RNN mode.
We can cross out equation 3b for dramatic effect.</p>

<p>\[\xcancel{y=\mathbf{\bar{K}} * x}\]</p>

<p>This posed a problem for Mamba’s authors: training in RNN mode is <em>really</em> slow.
Imagine we’re training our model on a sequence with 1,000 tokens.
A CNN would essentially compute a dot product between its kernel and the input vector, and it can do these computations in parallel.
By comparison, an RNN would need to update its hidden state 1,000 times in sequence.
This slow training time of RNNs is more or less what has prevented them from ever really taking off, and it led Mamba’s authors to their second big idea.</p>

<h2 id="idea-2-fast-training-without-convolutions">Idea #2: Fast training without convolutions</h2>

<p>The second major idea of Mamba involves training in RNN mode very, very quickly.
At some point, Gu and Dao realized that their recurrence was very similar to a <em>scan algorithm</em>, also known as a prefix sum.
To compute a prefix sum, we need to take an input array \([x_1, x_2, x_3, \cdots, x_n]\) and return an output array where each element is the sum of that item and the items that came before it.
In other words, the first element of the output will be \(x_1\), the second element will be \(x_1+x_2\), the third \(x_1+x_2+x_3\), and so on.
An example is shown below.</p>

<figure class="lesswidth whitebg">
<img src="/img/blog/mamba/prefix-sum.svg" />
</figure>

<p>Now let’s draw out the process for updating Mamba’s hidden state in RNN mode.
Wait a minute…</p>

<figure class="lesswidth whitebg">
<img src="/img/blog/mamba/prefix-sum-rnn.svg" />
</figure>

<p>Let’s think about this.
If we had to formalize a prefix sum, we could write it out as the following equation:</p>

<p>\[h_t=h_{t-1}+x_t\]</p>

<p>This equation forms a recurrence: at each step, we compute the new value by adding the previous stored value to the current input.
Now, let’s look again at the recurrence for updating Mamba’s hidden state.</p>

<p>\[h_t=\mathbf{\bar{A}}h_{t-1}+\mathbf{\bar{B}}x_t\]</p>

<p>These are really, really similar!<sup><a href="#fn5" id="ref5">5</a></sup>
And here’s the cool part: while computing a prefix sum may seem inherently sequential in nature, we actually have efficient parallel algorithms for this task!
In the diagram below, we can see a <a href="https://en.wikipedia.org/wiki/Prefix_sum#Algorithm_2:_Work-efficient" target="\_blank">parallel prefix sum</a> algorithm in action, where each vertical line represents one item in our array.</p>

<figure class="lesswidth whitebg">
<img src="/img/blog/mamba/parallel-prefix-sum.svg" />
<figcaption>Credit: <a href="https://commons.wikimedia.org/w/index.php?curid=14985743" target="_blank">David Eppstein</a></figcaption>
</figure>

<p>Take a second to convince yourself that this algorithm works: choose any vertical line, start at the top, and work your way down, tracing each addition back to the array’s first few items.
By the time you reach the bottom, you should have the sum of all items to the left of your line.
For example, you can see that the array’s third element receives the added value of the second element at the end, after the first element is added to the second element at the beginning.
As a result, the third element contains the sum of the first, second, and third elements by the time the parallel scan is finished.</p>

<p>If we were running this algorithm in a single thread, with no parallelism, it would take longer than if we were just adding the values together in sequence.
But GPUs have lots of processors, allowing for highly parallel computation.
As a result, we can compute this prefix sum (or scan) operation in roughly \(O(\log n)\) time!</p>

<p>So Mamba’s authors realized that if they wanted to train efficiently in RNN mode, they could probably use a parallel scan.
Since PyTorch <a href="https://github.com/pytorch/pytorch/issues/50688" target="\_blank">does not currently have</a> a scan implementation, Mamba’s authors wrote one themselves, and the results weren’t great.</p>

<figure class="morewidth whitebg">
<img src="/img/blog/mamba/scan-perf-no-pytorch.png" />
<figcaption class="right">Credit: Gu and Dao, 2023</figcaption>
</figure>

<p>In the figure above, you can see that their PyTorch-based scan implementation (green) is always slower than <a href="https://arxiv.org/abs/2307.08691" target="\_blank">FlashAttention-2</a> (blue), the fastest available “exact Attention” implementation.<sup><a href="#fn6" id="ref6">6</a></sup>
At a sequence length of 128,000 tokens, where the scan almost seems to catch up in runtime, it runs out of memory.
In order for Mamba to be practical, it needed to be faster.
This brought Mamba’s authors to Dao’s prior work on FlashAttention.</p>

<h2 id="review-flashattention">Review: FlashAttention</h2>

<p><a href="https://arxiv.org/abs/2205.14135" target="\_blank">FlashAttention</a> is a very fast implementation of Attention.
When published, FlashAttention trained BERT-large 15% faster than the previous fastest training time, and it was 3 times faster than the widely-used HuggingFace implementation of GPT-2.</p>

<p>In a nutshell, FlashAttention’s key insight has to do with the speeds at which different operations run on your GPU.
They realized that some GPU operations are <em>compute-bound</em>, meaning they are limited by the speed at which your GPU performs computations.
However, other operations are <em>memory-bound</em>, meaning they are limited by the speed at which your GPU is able to transfer data.</p>

<p>Imagine you and a friend are playing a game: your friend has to run 50 meters to deliver two numbers to you, which you then need to multiply by hand.
A timer starts when your friend begins running, and ends when you get the answer.
Let’s say the numbers you need to multiply are 439,145,208 and 142,426,265.
It would take you awhile to multiply these by hand.
Your friend might take 5 seconds to deliver the numbers, but you might take 60 seconds to perform the multiplication.
As a result, you are both compute-bound, since most of your time is spent on computation.
Now, imagine the numbers you need to multiply are 4 and 3.
While your friend still takes 5 seconds to run 50 meters, you can compute this result instantly.
Now, you are both memory-bound, since most of your time is spent transferring data.</p>

<p>In this analogy, your GPU is essentially racing to move data into the right places to perform its computations.
For example, let’s consider a masking operation.
To compute a masked vector, your GPU simply needs to erase data values whenever the mask is equal to zero (and keep them the same whenever it is equal to one).
If we used \(\boldsymbol{\oslash}\) to denote a masking operation, an example of this would be as follows, where the mask forces us to set the last three data elements to zero:</p>

<p>\[
\begin{pmatrix}
4 &amp; 9 &amp; 4 &amp; 1 &amp; 2 &amp; 7
\end{pmatrix} \hspace{0.1cm}\boldsymbol{\oslash}\hspace{0.1cm} \begin{pmatrix}
1 &amp; 1 &amp; 1 &amp; 0 &amp; 0 &amp; 0
\end{pmatrix}=\boxed{\begin{pmatrix}
4 &amp; 9 &amp; 4 &amp; 0 &amp; 0 &amp; 0
\end{pmatrix}}
\]</p>

<p>Since this is extremely easy to compute, your GPU ends up spending most of its time transferring memory, to move the data and mask matrices into the right places for computation.
This means that masking is memory-bound.
On the other hand, matrix multiplication involves lots and lots of additions and multiplications.
Because so much more time is spent on computation than memory transfers, matrix multiplication is compute-bound.
With this in mind, let’s look at a breakdown of the computations performed during Attention (matmul = matrix multiplication).</p>

<figure class="evenlesswidth whitebg">
<img src="/img/blog/mamba/flashattention-breakdown.png" />
<figcaption>Credit: Dao et al., 2022</figcaption>
</figure>

<p>It turns out that dropout, softmax, and masking, which make up the bulk of Attention’s runtime, are all <em>memory-bound</em>.
This means that most of the time we spend computing Attention is simply spent waiting for your GPU to move around data.
With this in mind, I assume FlashAttention’s authors wondered, how can we speed up operations that are bounded by the speed of memory transfers?</p>

<p>This led FlashAttention’s authors to another key realization: GPU memory has two major regions.
One of these, high-bandwidth memory (HBM), is really big, but really slow.
The other one, static random-access memory (SRAM), is really small, but really fast.
Let’s break down the differences between these regions on an A100 GPU:</p>

<figure class="lesswidth whitebg">
<img src="/img/blog/mamba/memory-hierarchy.png" />
<figcaption>Credit: Dao et al., 2022</figcaption>
</figure>

<p>FlashAttention’s authors realized that you can compute memory-bound operations more efficiently if you’re extra careful about how you use these regions of GPU memory.
They use an approach called tiling, in which small portions of your data are moved from HBM (slower) to SRAM (faster), computed in SRAM, and then moved back from SRAM to HBM.
This makes FlashAttention really, really fast, while still being numerically equivalent to Attention.</p>

<figure class="whitebg">
<img src="/img/blog/mamba/flashattention-computation.png" />
<figcaption>Credit: Dao et al., 2022</figcaption>
</figure>

<p>The details of how this works are fascinating, and I encourage you to check out the <a href="https://arxiv.org/abs/2205.14135" target="\_blank">FlashAttention paper</a> to learn more.
However, for the purpose of understanding Mamba, this is basically all you need to know.</p>

<h2 id="back-to-mamba">Back to Mamba</h2>

<p>Remember that before we started this tangent on FlashAttention, we were trying to speed up our parallel scan implementation.
Here is the same graph from earlier, where we can see that the scan implementation in PyTorch (green) is always slower than FlashAttention, the fastest “exact” Transformer (blue).<sup><a href="#fn7" id="ref7">7</a></sup></p>

<figure class="morewidth whitebg">
<img src="/img/blog/mamba/scan-perf-no-pytorch.png" />
<figcaption class="right">Credit: Gu and Dao, 2023</figcaption>
</figure>

<p>It turns out that if you take this same memory-aware tiling approach when computing a scan, you can speed things up a lot.
With this optimization in place, Mamba (red) is now faster than FlashAttention-2 (blue) at all sequence lengths.</p>

<figure class="morewidth whitebg">
<img src="/img/blog/mamba/scan-perf.png" />
<figcaption class="right">Credit: Gu and Dao, 2023</figcaption>
</figure>

<p>These results show that as far as speed goes, Mamba is practical, operating at a faster speed than the fastest exact Transformers.
But is it any good at language modeling?</p>

<h2 id="results">Results</h2>

<p>Gu and Dao evaluate Mamba on a number of sequence modeling tasks involving language, genomics, and audio.
I’m not as familiar with the latter two domains, but the results look cool: Mamba establishes state-of-the-art performance when modeling DNA from the Human Genome project, and audio from a piano music dataset.
However, it’s the language results that have gotten many people excited.
A lot of the online discourse about Mamba has focused on Figure 4, which I’ve included below.</p>

<figure class="morewidth whitebg">
<img src="/img/blog/mamba/the-pile-8192.png" />
<figcaption class="right">Credit: Gu and Dao, 2023</figcaption>
</figure>

<p>In this graph, model size increases to the right, and language modeling performance improves as you go further down.<sup><a href="#fn8" id="ref8">8</a></sup>
This means that the best models should be down and to the left: small (and therefore fast), and also very good at modeling language.
Since Gu and Dao are academics, they don’t have thousands of GPUs available to train a GPT-4-sized model, so they made this comparison by training a bunch of smaller models, around 125M to 1.3B parameters.
As the graph above shows, the results look really promising.
When compared to other models of similar sizes, Mamba appears to be the best at modeling language.</p>

<h2 id="what-next">What next?</h2>

<p>I really enjoyed writing this blogpost, as I think Mamba innovates on language modeling in a pretty unique and interesting way!
Unfortunately, a few reviewers didn’t agree: Gu and Dao planned to present Mamba at ICLR in May, but their paper was <a href="https://openreview.net/forum?id=AL1fq05o7H&amp;noteId=fSWIfBSjdu" target="\_blank">rejected</a> a couple weeks ago, causing some bewildered reactions online.</p>

<blockquote class="twitter-tweet"><p lang="en" dir="ltr">Mamba apparently was rejected !? (<a href="https://t.co/bjtmZimFsS">https://t.co/bjtmZimFsS</a>)<br /><br />Honestly I don&#39;t even understand. If this gets rejected, what chance do us 🤡 s have.</p>&mdash; Sasha Rush (@srush_nlp) <a href="https://twitter.com/srush_nlp/status/1750526956452577486?ref_src=twsrc%5Etfw">January 25, 2024</a></blockquote>
<script async="" src="https://platform.twitter.com/widgets.js" charset="utf-8"></script>

<p>I would guess Gu and Dao are working now on the next version of the paper, and I would also imagine some companies with more GPUs than they know what to do with are currently trying to figure out whether Mamba’s performance holds up at larger model sizes.
As we continue to want models that can process more and more tokens at once, linear-time models such as Mamba might someday provide an answer if they can demonstrate good performance.
Until then, we can keep hacking away on our lame, old-school Transformers.</p>

<div id="mc_embed_signup">
  <form action="https://jackcook.us3.list-manage.com/subscribe/post?u=092c1ebd5c3af75029c7d88b7&amp;id=c5b12a8c85&amp;f_id=00582ee2f0" method="post" id="mc-embedded-subscribe-form" name="mc-embedded-subscribe-form" class="validate" target="_blank" novalidate="">
    <div id="mc_embed_signup_scroll" class="default">
      <div class="mc-field-group">
        <input type="email" value="" name="EMAIL" placeholder="Enter your email" class="required email" id="mce-EMAIL" />
        <div id="mce-responses" class="clear">
          <div id="mce-error-response" class="response" style="display: none"></div>
          <div id="mce-success-response" class="response" style="display: none"></div>
        </div>
      </div>
      <!-- real people should not fill this in and expect good things - do not remove this or risk form bot signups-->
      <div style="position: absolute; left: -5000px" aria-hidden="true">
        <input type="text" name="b_092c1ebd5c3af75029c7d88b7_c5b12a8c85" tabindex="-1" value="" />
      </div>
      <div class="clear">
        <input type="submit" value="Subscribe" name="subscribe" id="mc-embedded-subscribe" class="button" />
      </div>
    </div>
  </form>
</div>

<div class="acknowledgment-border"></div>
<div id="footnotes">
<sup id="fn1">1. Faster Transformers such as <a href="https://developers.googleblog.com/2024/02/gemini-15-available-for-private-preview-in-google-ai-studio.html" target="_blank">Gemini 1.5</a> are almost certainly using Attention modifications, e.g. <a href="https://arxiv.org/abs/2310.01889" target="_blank">RingAttention</a>, <a href="https://arxiv.org/abs/2309.17453" target="_blank">StreamingLLM</a>, <a href="https://arxiv.org/abs/2006.16236" target="_blank">Linear Attention</a>. <a href="#ref1" title="Jump back to footnote 1 in the text.">&#8617;</a></sup>
<sup id="fn2">2. <a href="https://en.wikipedia.org/wiki/Kernel_(image_processing)#Convolution" target="_blank">CNNs flip the kernel</a> to perform convolution, which is why \(\mathbf{\bar{K}}\) looks backwards compared to the left-hand vector from our derivation of \(y_3\). <a href="#ref2" title="Jump back to footnote 2 in the text.">&#8617;</a></sup>
<sup id="fn3">3. In this table, \(\boldsymbol{L}\) denotes sequence length, \(\boldsymbol{B}\) denotes batch size, \(\boldsymbol{H}\) denotes the model’s hidden size, and tildes denote log factors. Don’t worry about the math too much for the purpose of this blogpost. <a href="#ref3" title="Jump back to footnote 3 in the text.">&#8617;</a></sup>
<sup id="fn4">4. In reality it’s <a href="https://hazyresearch.stanford.edu/blog/2022-01-14-s4-3" target="_blank">a little more complicated</a> than this: the continuous \(\mathbf{A}\) is constant, while our discretization parameter \(\Delta\) is input-dependent. \(\mathbf{\bar{A}}\) is therefore input-dependent as a result of discretization. <a href="#ref4" title="Jump back to footnote 4 in the text.">&#8617;</a></sup>
<sup id="fn5">5. Mamba’s recurrence and the prefix sum are “similar” because importantly, Mamba’s recurrence is a linear transformation of its inputs. This is not true of RNNs, which is why we can’t use a parallel scan to train RNNs. <a href="#ref5" title="Jump back to footnote 5 in the text.">&#8617;</a></sup>
<sup id="fn6">6. If you read footnote 1, note that FlashAttention/FlashAttention-2 is a different type of Attention modification because unlike those examples, FlashAttention is <em>numerically equivalent</em> to standard Attention. It’s faster, but it yields the exact same outputs. FlashAttention’s authors refer to this as computing “exact Attention.” <a href="#ref6" title="Jump back to footnote 6 in the text.">&#8617;</a></sup>
<sup id="fn7">7. See footnote 6. <a href="#ref7" title="Jump back to footnote 7 in the text.">&#8617;</a></sup>
<sup id="fn8">8. Perplexity, shown on the y axis, is a common measure of language modeling performance. If you’re given the first part of a sentence and asked to predict the next word, you can think of perplexity as a value indicating how “perplexed” you are when you are shown the right answer. For example, if you are given the sequence “I went for a walk outside”, you shouldn’t be too surprised when the next word is “today.” Lower values indicate you are less perplexed, and therefore have a better understanding of how language works. <a href="#ref8" title="Jump back to footnote 8 in the text.">&#8617;</a></sup>
</div>]]></content><author><name></name></author><summary type="html"><![CDATA[An overview of the big ideas behind Mamba, a brand-new language model architecture.]]></summary></entry><entry><title type="html">A look at Apple’s new Transformer-powered predictive text model</title><link href="https://jackcook.com/2023/09/08/predictive-text.html" rel="alternate" type="text/html" title="A look at Apple’s new Transformer-powered predictive text model" /><published>2023-09-08T00:00:00+00:00</published><updated>2023-09-08T00:00:00+00:00</updated><id>https://jackcook.com/2023/09/08/predictive-text</id><content type="html" xml:base="https://jackcook.com/2023/09/08/predictive-text.html"><![CDATA[<p>At WWDC earlier this year, Apple announced that upcoming versions of iOS and macOS would ship with a new feature powered by “<a href="https://www.apple.com/newsroom/2023/06/ios-17-makes-iphone-more-personal-and-intuitive/">a Transformer language model</a>” that will give users “predictive text recommendations inline as they type.”</p>

<p>Upon hearing this announcement, I was pretty curious about how this feature works.
Apple hasn’t deployed many language models of their own, despite most of their competitors going all-in on large language models over the last couple years.
I see this as a result of Apple generally priding themselves on polish and perfection, while language models are fairly unpolished and imperfect.</p>

<p>As a result, this may be one of the first Transformer-based models that Apple will ship in one of its operating systems, or at least one of the first that they’ve acknowledged publicly.
This left me with some questions about the feature, notably:</p>

<ul>
  <li>What underlying model is powering this feature?</li>
  <li>What is its architecture?</li>
  <li>What data was used to train the model?</li>
</ul>

<p>After spending some time with these questions, I was able to find some answers, but many of the details still remain unclear.
If you’re able to get any further than I could, please get in touch!</p>

<h2 id="how-does-the-feature-work">How does the feature work?</h2>

<p>After installing the macOS beta, I immediately opened the Notes app and started typing.
Despite trying many different sentence structures, the feature generally appeared less often than I expected it to.
It mostly completes individual words.</p>

<figure>
<img src="/img/blog/predictive-text/individual-word-2.png" />
<figcaption>Predictive text completing one word at a time.</figcaption>
</figure>

<p>The feature will occasionally suggest more than one word at a time, but this is generally limited to instances where the upcoming words are extremely obvious, similar to the autocomplete in Gmail.</p>

<figure>
<img src="/img/blog/predictive-text/multiple-words.jpeg" />
<figcaption>Predictive text completing two words at a time.</figcaption>
</figure>

<h2 id="can-we-dig-deeper">Can we dig deeper?</h2>

<p>Finding the model itself was a little tough, but I eventually found the model being used by <code class="language-plaintext highlighter-rouge">AppleSpell</code>, an internal macOS application that checks for spelling and grammar mistakes as you type.
With the help of <a href="https://github.com/hot3eed/xpcspy"><code class="language-plaintext highlighter-rouge">xpcspy</code></a>, I wrote a Python script that snoops on <code class="language-plaintext highlighter-rouge">AppleSpell</code> activity and streams the most probable suggestions from the predictive text model as you type in any application.</p>

<figure>
<video controls="" src="/img/blog/predictive-text/script-demo.mov" type="video/mov"></video>
<figcaption>My “predictive spy” script in action.</figcaption>
</figure>

<p>Unfortunately, I wrote this script earlier in the summer, on the first macOS Sonoma beta.
In one of the subsequent betas (I’m not sure which), Apple removed the unused completions from the XPC messages sent by AppleSpell.
I wasn’t able to glean too much about the model’s behavior from these completions, but it was still a cool find.</p>

<h2 id="where-is-the-model">Where is the model?</h2>

<p>After some more digging, I’m pretty sure I found the predictive text model in <code style="word-break: break-all">/System/Library/LinguisticData/RequiredAssets_en.bundle/AssetData/en.lm/unilm.bundle</code>.
The bundle contains multiple Espresso model files that are used while typing (Espresso <a href="https://machinethink.net/blog/peek-inside-coreml/">appears to be</a> the internal name for the part of CoreML that runs inference on models).
I wasn’t ultimately able to reverse-engineer the model, but I’m fairly confident this is where the predictive text model is kept.
Here’s why:</p>

<ol>
  <li>Many of the files in <code class="language-plaintext highlighter-rouge">unilm.bundle</code> don’t exist on macOS Ventura (13.5), but they do exist on the macOS Sonoma beta (14.0). And the files that do exist in both versions have all been updated in Sonoma.</li>
  <li><code class="language-plaintext highlighter-rouge">sp.dat</code>, one of the files in <code class="language-plaintext highlighter-rouge">unilm.bundle</code>, exists on Ventura, but it’s been updated in the Sonoma beta. In the updated version of the file, I found what looks pretty clearly like a set of tokens for a tokenizer.</li>
  <li>The number of tokens in <code class="language-plaintext highlighter-rouge">sp.dat</code> matches the shape of the output layer in both <code style="word-break: break-all">unilm_joint_cpu.espresso.shape</code> and <code style="word-break: break-all">unilm_joint_ane.espresso.shape</code> (ANE = Apple Neural Engine), two files in <code class="language-plaintext highlighter-rouge">unilm.bundle</code> that describe the shapes of layers in an Espresso/CoreML model. This is what we would expect to see for a model that is trained to predict the next token.</li>
</ol>

<h2 id="the-predictive-text-models-tokenizer">The predictive text model’s tokenizer</h2>

<p>I found a set of 15,000 tokens in <code class="language-plaintext highlighter-rouge">unilm.bundle/sp.dat</code> that pretty clearly look like they form the vocabulary set for a large language model.
I wrote a script that you can use to see this vocabulary file for yourself, which you can check out <a href="https://github.com/jackcook/predictive-spy">on GitHub</a>.</p>

<p>The vocabulary starts with <code class="language-plaintext highlighter-rouge">&lt;pad&gt;</code>, <code class="language-plaintext highlighter-rouge">&lt;s&gt;</code>, <code class="language-plaintext highlighter-rouge">&lt;/s&gt;</code>, and <code class="language-plaintext highlighter-rouge">&lt;unk&gt;</code> tokens, which are all fairly common special tokens (<code class="language-plaintext highlighter-rouge">roberta-base</code> and <code class="language-plaintext highlighter-rouge">t5-base</code> are two popular language models):</p>

<div class="language-python highlighter-rouge"><div class="highlight"><pre class="highlight"><code><span class="o">&gt;&gt;&gt;</span> <span class="kn">from</span> <span class="nn">transformers</span> <span class="kn">import</span> <span class="n">AutoTokenizer</span>
<span class="o">&gt;&gt;&gt;</span>
<span class="o">&gt;&gt;&gt;</span> <span class="n">tokenizer</span> <span class="o">=</span> <span class="n">AutoTokenizer</span><span class="p">.</span><span class="n">from_pretrained</span><span class="p">(</span><span class="s">"roberta-base"</span><span class="p">)</span>
<span class="o">&gt;&gt;&gt;</span> <span class="n">tokenizer</span><span class="p">.</span><span class="n">convert_ids_to_tokens</span><span class="p">([</span><span class="mi">0</span><span class="p">,</span> <span class="mi">1</span><span class="p">,</span> <span class="mi">2</span><span class="p">,</span> <span class="mi">3</span><span class="p">])</span>
<span class="p">[</span><span class="s">'&lt;s&gt;'</span><span class="p">,</span> <span class="s">'&lt;pad&gt;'</span><span class="p">,</span> <span class="s">'&lt;/s&gt;'</span><span class="p">,</span> <span class="s">'&lt;unk&gt;'</span><span class="p">]</span>
<span class="o">&gt;&gt;&gt;</span>
<span class="o">&gt;&gt;&gt;</span> <span class="n">tokenizer</span> <span class="o">=</span> <span class="n">AutoTokenizer</span><span class="p">.</span><span class="n">from_pretrained</span><span class="p">(</span><span class="s">"t5-base"</span><span class="p">)</span>
<span class="o">&gt;&gt;&gt;</span> <span class="n">tokenizer</span><span class="p">.</span><span class="n">convert_ids_to_tokens</span><span class="p">([</span><span class="mi">0</span><span class="p">,</span> <span class="mi">1</span><span class="p">,</span> <span class="mi">2</span><span class="p">])</span>
<span class="p">[</span><span class="s">'&lt;pad&gt;'</span><span class="p">,</span> <span class="s">'&lt;/s&gt;'</span><span class="p">,</span> <span class="s">'&lt;unk&gt;'</span><span class="p">]</span>
</code></pre></div></div>

<p>Next come the following sequences:</p>

<ul>
  <li>20 special tokens, named <code class="language-plaintext highlighter-rouge">UniLMCTRL0</code> through <code class="language-plaintext highlighter-rouge">UniLMCTRL19</code></li>
  <li>79 contractions (I’d, couldn’t, you’ve…)</li>
  <li>1 special <code class="language-plaintext highlighter-rouge">_U_CAP_</code> token</li>
  <li>20 special tokens, named <code class="language-plaintext highlighter-rouge">_U_PRE0_</code> through <code class="language-plaintext highlighter-rouge">_U_PRE19_</code></li>
  <li>60 special tokens, named <code class="language-plaintext highlighter-rouge">_U_NT00_</code> through <code class="language-plaintext highlighter-rouge">_U_NT59_</code></li>
  <li>100 emojis</li>
</ul>

<p>And then comes a more normal-looking list of 14,716 tokens, most of which are followed by the special character ▁ (U+9601), which is commonly used in byte-pair encoding (BPE) tokenizers, such as the GPT-2 tokenizer, to denote a space.</p>

<p>I have to say that this vocabulary file strikes me as pretty unique, but it’s definitely not out of the question for a language model deployed in this setting.
I’ve personally never seen emojis featured so prominently in a language model’s tokenizer, but <a href="https://arxiv.org/abs/2007.15779">existing</a> <a href="https://arxiv.org/abs/2303.17564">research</a> has shown that domain-specific models and tokenizers can drastically improve downstream model performance.
So it makes sense that a model trained for use in things like text messages, in which emojis and contractions will be used a lot, would prioritize them.</p>

<h2 id="model-architecture">Model architecture</h2>

<p>Based on the contents of the <code class="language-plaintext highlighter-rouge">unilm_joint_cpu</code> model from earlier, we can make some assumptions about the predictive text network.
Despite sharing the name of Microsoft’s <a href="https://www.microsoft.com/en-us/research/publication/unified-language-model-pre-training-for-natural-language-understanding-and-generation/">UniLM</a> from 2019, it looks more to me like a model based on <a href="https://openai.com/research/better-language-models">GPT-2</a>.</p>

<p>GPT-2 has four main parts: token embeddings, positional encodings, a series of 12-48 decoder blocks, and an output layer.
The network described by <code class="language-plaintext highlighter-rouge">unilm_joint_cpu</code> appears to be the same, except with only 6 decoder blocks.
Most of the layers within each decoder block have names like <code style="word-break: break-all">gpt2_transformer_layer_3d</code>, which would also seem to suggest it’s based on a GPT-2 architecture.</p>

<p>From my calculations based on sizes of each layer, Apple’s predictive text model appears to have about 34 million parameters, and it has a hidden size of 512 units.
This makes it much smaller than even the smallest version of GPT-2.</p>

<table>
  <thead>
    <tr>
      <th style="text-align: left">Model</th>
      <th style="text-align: right">Decoder Blocks</th>
      <th style="text-align: right">Parameters</th>
      <th style="text-align: right">Hidden Size</th>
    </tr>
  </thead>
  <tbody>
    <tr>
      <td style="text-align: left">Apple’s predictive text model</td>
      <td style="text-align: right">6</td>
      <td style="text-align: right">34M</td>
      <td style="text-align: right">512</td>
    </tr>
    <tr>
      <td style="text-align: left">gpt2</td>
      <td style="text-align: right">12</td>
      <td style="text-align: right">117M</td>
      <td style="text-align: right">768</td>
    </tr>
    <tr>
      <td style="text-align: left">gpt2-medium</td>
      <td style="text-align: right">24</td>
      <td style="text-align: right">345M</td>
      <td style="text-align: right">1024</td>
    </tr>
    <tr>
      <td style="text-align: left">gpt2-large</td>
      <td style="text-align: right">36</td>
      <td style="text-align: right">762M</td>
      <td style="text-align: right">1280</td>
    </tr>
    <tr>
      <td style="text-align: left">gpt2-xl</td>
      <td style="text-align: right">48</td>
      <td style="text-align: right">1542M</td>
      <td style="text-align: right">1600</td>
    </tr>
  </tbody>
</table>

<p>For the limited scope of the predictive text feature, this makes sense to me.
Apple wants a model that can run very quickly and very frequently, without draining much of your device’s battery.
When I was testing the predictive text feature, suggestions appeared almost instantly as I typed, making for a great user experience.
While the model’s limited size means it wouldn’t be very good at writing full sentences or paragraphs, when it exhibits very high confidence in the next word or two, they’re likely to be good enough to suggest to the user.</p>

<p>However, with my script that snoops on activity from <code class="language-plaintext highlighter-rouge">AppleSpell</code>, we can get the model to write full sentences anyway.
If I type “Today” as the first word of my sentence and take the model’s top suggestion each time, here’s what I get (<a href="/img/blog/predictive-text/longer-demo.mov">video</a>):</p>

<blockquote>
  <p>Today is the day of the day and the day of the week is going to be a good thing I have to do is get a new one for the next couple weeks and I think I have a lot of…</p>
</blockquote>

<p>Not very inspiring.
We can compare this with the output from the smallest GPT-2 model:</p>

<blockquote>
  <p>Today, the White House is continuing its efforts against Iran to help the new President, but it will also try to build new alliances with Iran to make more…</p>
</blockquote>

<p>Or the largest GPT-2 model:</p>

<blockquote>
  <p>Today, the U.S. Department of Justice has filed a lawsuit against the city of Chicago, the Chicago Police Department, and the city’s Independent Police Review Authority, alleging that the police department and the Independent Police Review Authority engaged in a pattern or practice…</p>
</blockquote>

<p>Pretty cool seeing the effects of all those extra parameters!
It’ll be interesting to see how this feature grows and evolves in the future, and whether Apple decides to keep its scope fairly narrow or someday expand its abilities.</p>

<p>If you’re interested in trying any of this out for yourself, all of my code is on <a href="https://github.com/jackcook/predictive-spy">GitHub</a>.</p>

<div id="mc_embed_signup">
  <form action="https://jackcook.us3.list-manage.com/subscribe/post?u=092c1ebd5c3af75029c7d88b7&amp;id=c5b12a8c85&amp;f_id=00582ee2f0" method="post" id="mc-embedded-subscribe-form" name="mc-embedded-subscribe-form" class="validate" target="_blank" novalidate="">
    <div id="mc_embed_signup_scroll" class="default">
      <div class="mc-field-group">
        <input type="email" value="" name="EMAIL" placeholder="Enter your email" class="required email" id="mce-EMAIL" />
        <div id="mce-responses" class="clear">
          <div id="mce-error-response" class="response" style="display: none"></div>
          <div id="mce-success-response" class="response" style="display: none"></div>
        </div>
      </div>
      <!-- real people should not fill this in and expect good things - do not remove this or risk form bot signups-->
      <div style="position: absolute; left: -5000px" aria-hidden="true">
        <input type="text" name="b_092c1ebd5c3af75029c7d88b7_c5b12a8c85" tabindex="-1" value="" />
      </div>
      <div class="clear">
        <input type="submit" value="Subscribe" name="subscribe" id="mc-embedded-subscribe" class="button" />
      </div>
    </div>
  </form>
</div>]]></content><author><name></name></author><summary type="html"><![CDATA[I found some details about Apple’s new predictive text model, coming soon in iOS 17 and macOS Sonoma.]]></summary></entry><entry><title type="html">I went on a roadtrip to investigate T-Mobile’s coverage map</title><link href="https://jackcook.com/2022/04/11/tmobile.html" rel="alternate" type="text/html" title="I went on a roadtrip to investigate T-Mobile’s coverage map" /><published>2022-04-11T12:00:00+00:00</published><updated>2022-04-11T12:00:00+00:00</updated><id>https://jackcook.com/2022/04/11/tmobile</id><content type="html" xml:base="https://jackcook.com/2022/04/11/tmobile.html"><![CDATA[<p>It was 11:54am on January 1, 2021, and I was parked at a Micro Center in Brooklyn. With my laptop wedged between my knee and the steering wheel, I was putting the finishing touches on a device that, once completed, would connect to my phone and record my cell service as I drove across the country. I was about to begin a six-week road trip during which I would hike, ski, visit friends and family, and explore. As I was planning the trip nearly two months earlier, I had an idea.</p>

<p>For as long as I can remember, I’ve been frustrated by the service provided to me by T-Mobile. Whether I’m in my room, hiking in the woods, or walking around downtown Boston, I can never seem to use the Internet when I need it. I’ll open the Mail app, tap on an email, and… nothing. “This message has not been downloaded from the server.” I’ll go back to my apartment in Cambridge, check the <a href="https://www.t-mobile.com/coverage/coverage-map">T-Mobile coverage map</a>, and see what my coverage <em>should</em> have been wherever I was. “5G. Ultra Capacity.” Right.</p>

<figure class="fullwidth">
  <img src="/img/blog/tmobile/coverage-map.png" />
  <figcaption>A screenshot of the T-Mobile coverage map for MIT, as of April 10, 2022.</figcaption>
</figure>

<p>Was I just getting unlucky? Or was T-Mobile’s service actually far worse than advertised? The scientist in me <em>had</em> to know. If I could collect a large sample of T-Mobile coverage data, I could compare my experienced coverage to the coverage advertised on their website. And that’s exactly what I was about to do. Despite having planned my trip two months earlier, fully knowing I wanted to run this experiment, I had procrastinated until the very last minute to finish my recording device.</p>

<p>I programmed a <a href="https://www.raspberrypi.com/products/raspberry-pi-zero/">Raspberry Pi Zero</a>, a computer that costs $5 and is about half the size of a credit card, to connect to my iPhone 12 and take screenshots of the home screen at 1-minute intervals. The program would then check the top right corner of each screenshot and record how many bars I had, which indicates signal strength, and which network I was connected to, such as 4G or 5G. It would then save those metrics along with my phone’s location and the current time while I drove, and at the end of my trip, I’d have a database with thousands of these entries recorded from along my route.</p>

<p>After buying a missing cable and fixing some last-minute bugs, I finally got the device working and pulled out of the parking lot. My first stop was going to be Ann Arbor, Michigan. I was going to drive nine hours from New York City to Ann Arbor in one day, and I was starting at 1pm. One of my many great ideas.</p>

<hr />

<p>What I didn’t know yet was that I was driving straight into a winter storm. As I started driving along I-80 through central Pennsylvania, the clouds darkened until I eventually saw my first few snowflakes. Within minutes, the flurries had turned into a full-on blizzard. Everyone driving on the highway slowed down from 80 miles per hour, 10 above the posted speed limit of 70, to 40 miles per hour or less. I passed multiple cars that had spun off the highway, and I even placed a 911 call about one that had skidded into a ditch several feet off the road. Visibility was extremely poor.</p>

<p>Several hours later, I finally arrived in Ann Arbor at 12:49am. The drive, which would usually take nine hours without traffic, ended up taking twelve hours. And yet, in my state of exhaustion, I couldn’t help but take a quick look at the data I had collected. Were the T-Mobile coverage maps accurate after all? Did my device even work?</p>

<figure class="fullwidth">
  <img src="/img/blog/tmobile/maps/map1.png" />
  <div class="legend">
    <div class="item">
      <div class="inline-color-line" style="background: #e6e6e6"></div>
      <div class="inline-label">Same as advertised</div>
    </div>
    <div class="item">
      <div class="inline-color-line" style="background: #ff968f"></div>
      <div class="inline-label">One ‘G’ worse</div>
    </div>
    <div class="item">
      <div class="inline-color-line" style="background: #c31f13"></div>
      <div class="inline-label">Two ‘G’s worse</div>
    </div>
  </div>
</figure>

<p>To my delight, the device worked flawlessly. I could clearly see the 575 GPS points lining my route from Brooklyn to Ann Arbor. And the data yielded several interesting insights when compared to T-Mobile’s advertised coverage, which I collected by reverse-engineering the T-Mobile coverage map. On I-80 in eastern Pennsylvania, my experienced coverage was clearly worse than what T-Mobile had advertised. Despite T-Mobile asserting that 5G service was available along my entire route, I could only access 4G for several hours of my drive.</p>

<p>While this alone was an interesting insight, all I could really say at this point was that T-Mobile’s coverage is worse than advertised… in eastern Pennsylvania. To build a strong case about the validity of their coverage map as a whole, I knew I would need much more data. I was excited to spend the next two days with a friend of mine who lived in Ann Arbor, but I also looked forward to the rest of my trip.</p>

<h2 id="limited-signal-strength">‘Limited’ signal strength?</h2>

<p>Three days later, I continued my journey. I was in for another long day of driving, from Ann Arbor, Michigan to Sioux Falls, South Dakota. The drive typically takes 12 hours without traffic, and this time, there was no snow in the forecast. Around 9am, I left for Chicago, where I planned to take a routine Covid test. After I finally found a parking spot in Chicago near the CVS where I would take my test, I opened my car door and stepped outside. I still remember what I felt in that moment. Cold. It was <em>freezing</em>. The “Windy City” brought powerful gusts that I could feel in every bone of my body. I put on my coat, stepped into the CVS to take my Covid test, went back to my car, and kept driving.</p>

<p>About four hours outside of Chicago, I got hungry and stopped for a bite to eat. I was in Wisconsin, and according to a friend of mine, driving through Wisconsin meant I would have to try <a href="https://www.culvers.com">Culver’s</a>. I had never heard of it, but apparently Culver’s is a midwestern fast food chain known for “ButterBurgers,” frozen custard, and cheese curds. After picking up my food at a drive thru, I parked and decided to watch a YouTube video while I ate. I tapped on a thumbnail, watched about five seconds of the video, and… it buffered. I tried turning my cellular data off and on again and reducing the video’s quality to the lowest available setting. It refused to play.</p>

<p>And yet, a quick look at T-Mobile’s coverage map would later reveal that their service in Onalaska, Wisconsin is advertised as 5G. Although, it came with a disclaimer: “Limited signal strength.” Presumably not quite as good as the “excellent” or “good” signal strength indicators it advertised elsewhere, but nowhere on the page did it explain what this meant. How much better is “good” than “limited”? “Excellent” compared to “good”? Should I expect to be able to watch a YouTube video if my coverage is “limited”? Stream a song on Spotify? How would this factor into my decision to buy a T-Mobile plan?</p>

<p>While writing this story, I found that as of December 2021, T-Mobile has removed these qualifiers from their coverage map, perhaps because of this ambiguity. Today, the coverage map in Onalaska just depicts 5G service as being available, with no indication of speed or reliability, which likely helps T-Mobile paint a rosy picture of their service to potential customers. Customers have no way to tell whether the 5G service they’re purchasing is going to be fast and reliable, or slow and spotty. Although having a <em>limited</em> understanding of service quality was better than nothing, this is arguably worse. It makes me wonder why there aren’t more stringent regulations on the coverage maps published by carriers.</p>

<p>I finished my ButterBurger and got back on I-90. The burger and fries were delicious, but I wasn’t sure when I would get the chance to try them again. I wondered why Culver’s hasn’t expanded beyond the Midwest. I kept driving, and about four hours later, I arrived in Sioux Falls, South Dakota. I filled my gas tank for the third time that day, checked into my Airbnb, and quickly checked my results again before getting some rest.</p>

<figure class="fullwidth">
  <img src="/img/blog/tmobile/maps/map2.png" />
  <div class="legend">
    <div class="item">
      <div class="inline-color-line" style="background: #e6e6e6"></div>
      <div class="inline-label">Same as advertised</div>
    </div>
    <div class="item">
      <div class="inline-color-line" style="background: #ff968f"></div>
      <div class="inline-label">One ‘G’ worse</div>
    </div>
  </div>
</figure>

<p>Surprisingly enough, I found that T-Mobile’s service was almost exactly as advertised for the entire 12-hour drive. The coverage map showed that parts of Michigan only had 4G, with 5G available along the rest of my route, which matched my recorded data. Would my final conclusion be that T-Mobile’s coverage map was actually… accurate? Only time would tell.</p>

<hr />

<p>I woke up the next day and decided to check out Sioux Falls, since I wasn’t sure if I would ever be back. I pulled out of the driveway and found myself behind a car with a bumper sticker that read, “Minnesota Sucks!” I drove around for a few minutes, passing by sights such as <a href="https://en.wikipedia.org/wiki/Falls_Park">Falls Park</a> and <a href="https://en.wikipedia.org/wiki/Cathedral_of_Saint_Joseph_(Sioux_Falls,_South_Dakota)">St. Joseph Cathedral</a>, before beginning my five-hour drive to Rapid City, the second largest city in South Dakota. I wasn’t too sure what I should have expected, but the drive, which went entirely along I-90, was almost completely empty. Miles upon miles of nothing, as far as the eye could see.</p>

<figure class="fullwidth">
  <img src="/img/blog/tmobile/flat-sd.jpeg" />
  <figcaption>View from a rest stop along I-90 between Sioux Falls and Rapid City. South Dakota is flat.</figcaption>
</figure>

<p>However, there’s plenty to do in South Dakota once you get near the western side of the state. I stayed in Rapid City for three days, during which I made sure to visit Badlands National Park and Mount Rushmore. I also hiked Black Elk Peak, the tallest mountain in South Dakota.</p>

<figure class="fullwidth">
  <img src="/img/blog/tmobile/badlands.jpeg" />
  <figcaption>Rock formations in Badlands National Park.</figcaption>
</figure>

<figure class="fullwidth">
  <img src="/img/blog/tmobile/blackhills.jpeg" />
  <figcaption>View from the top of Black Elk Peak. At 7,244 feet tall, the peak is the highest summit in the United States east of the Rocky Mountains.</figcaption>
</figure>

<figure class="fullwidth">
  <img src="/img/blog/tmobile/mt-rushmore.jpeg" />
  <figcaption>Mount Rushmore on a clear day. From left to right, the busts depict Presidents Washington, Jefferson, Roosevelt, and Lincoln.</figcaption>
</figure>

<p>At the end of my time in Rapid City, I compiled my results from South Dakota. I was especially curious to see my results from Black Hills National Forest, home to Mount Rushmore and Black Elk Peak. My recordings made on that day were some of the first I hade made off of major highways, and I didn’t have any cell service at all for portions of my time there.</p>

<figure class="fullwidth">
  <img src="/img/blog/tmobile/maps/map3.png" />
  <div class="legend">
    <div class="item">
      <div class="inline-color-line" style="background: #e6e6e6"></div>
      <div class="inline-label">Same as advertised</div>
    </div>
    <div class="item">
      <div class="inline-color-line" style="background: #ff968f"></div>
      <div class="inline-label">One ‘G’ worse</div>
    </div>
    <div class="item">
      <div class="inline-color-line" style="background: #c31f13"></div>
      <div class="inline-label">Two ‘G’s worse</div>
    </div>
    <div class="item">
      <div class="inline-color-line" style="background: #410101"></div>
      <div class="inline-label">Three ‘G’s worse</div>
    </div>
  </div>
</figure>

<p>Sure enough, T-Mobile advertised that they covered every location within the Black Hills that I had driven through. And yet, I only had service at 63% of all locations I had recorded from within the forest’s boundaries. I wasn’t able to record data outside of my car, but given how different these results were compared to my recordings made on interstates, I wondered if the results would have deviated further if I could have additionally taken recordings from hiking trails.</p>

<figure class="morewidth">
  <img src="/img/blog/tmobile/black-hills.svg" />
</figure>

<h2 id="spotty-signals">Spotty signals</h2>

<p>Two days later, I left Rapid City and started the next chapter of my trip. I was leaving the midwest and entering the northwestern United States. Despite some inconsistencies in Pennsylvania and South Dakota, my cell signal had mostly matched what T-Mobile had advertised, likely due to the abundance of flat terrain. Cell service is transmitted through radio waves, which easily pass through air but can be blocked by hills and mountains, making flatter states such as Wisconsin and Minnesota perfect for receiving a good signal.</p>

<p>I had also been driving mostly along interstates, which I suspected to be places that cell providers paid extra attention to when setting up service for an area. My next destination was Gardiner, Montana, a small town seated at the northern entrance to Yellowstone National Park. To get there, I would need to drive along some state highways for several hours before eventually rejoining I-90 later in the day.</p>

<p>The first few hours I spent on state highways in South Dakota, Wyoming, and Montana were brutal. These highways featured lots of packed snow and black ice, and they were also one-lane highways, which made it much more difficult to overtake the large, slow semi trucks.</p>

<figure class="fullwidth">
  <img src="/img/blog/tmobile/slippery-highway.jpeg" />
  <figcaption>Snow and ice covered a state highway in the southeastern corner of Montana.</figcaption>
</figure>

<p>However, the last hour I spent before merging back onto I-90 went through the Northern Cheyenne Indian Reservation, which featured one of the most beautiful drives of my entire trip. A heavy snowstorm had passed through the region the day before, coating all of the evergreen trees in a thick layer of snow and giving it the appearance of a winter wonderland. I didn’t have time to make a stop, but I made a mental note to come back someday in the future.</p>

<p>I then spent two and a half more hours on I-90 through Montana before turning onto U.S. Highway 89, which was also phenomenal. The drive to Gardiner passes through Paradise Valley, which must get its name because it looks like paradise. I drove between sets of enormous snowcapped mountains while watching the sun set over the peaks on my right. I also got to admire the Yellowstone River and the beautiful rolling hills. It’s common to see wildlife along this highway, but I unfortunately wouldn’t see any until I got to explore Yellowstone later in the week. I finally checked into my Airbnb around 6pm. This was the first location on my roadtrip where I would stay for more than a couple days, so I took some time to buy groceries, unpack, and cook dinner before checking my results.</p>

<figure class="fullwidth">
  <img src="/img/blog/tmobile/maps/map4.png" />
  <div class="legend">
    <div class="item">
      <div class="inline-color-line" style="background: #e6e6e6"></div>
      <div class="inline-label">Same as advertised</div>
    </div>
    <div class="item">
      <div class="inline-color-line" style="background: #ff968f"></div>
      <div class="inline-label">One ‘G’ worse</div>
    </div>
    <div class="item">
      <div class="inline-color-line" style="background: #c31f13"></div>
      <div class="inline-label">Two ‘G’s worse</div>
    </div>
    <div class="item">
      <div class="inline-color-line" style="background: #410101"></div>
      <div class="inline-label">Three ‘G’s worse</div>
    </div>
  </div>
</figure>

<p>As I had expected, results from the day’s drive were noticeably worse than what I had collected in the Northeast and the Midwest. For several minutes along a state highway in southeastern Montana, and again while passing through the Northern Cheyenne Reservation, I had no signal, despite T-Mobile’s claims that both areas were covered with 3G service or better. I also observed that data collected along I-90 matched T-Mobile’s advertised coverage much better.</p>

<figure class="lesswidth">
  <img src="/img/blog/tmobile/highways-mt.svg" />
</figure>

<p>Based on the results of my first major drive along non-interstate highways, it appeared to me that T-Mobile may be exaggerating its coverage even further for rural and underserved areas. I would have to wait to confirm this hunch by running this analysis again at the end of my trip.</p>

<p>I then spent a week snowshoeing in Yellowstone, which I can’t recommend enough. Most people choose to visit Yellowstone in the summer months, but there’s definitely something to be said about the beautiful winter scenery. Although cell service is spotty in Yellowstone, this was the one part of the country where I didn’t really mind having poor reception.</p>

<figure class="fullwidth">
  <img src="/img/blog/tmobile/yellowstone-1.jpeg" />
  <figcaption>Highway 89, which connects Yellowstone’s northern and western entrances, recedes into the distance. The road is only open to snowmobiles in the winter.</figcaption>
</figure>

<figure class="fullwidth">
  <img src="/img/blog/tmobile/yellowstone-2.jpeg" />
  <figcaption>An elk surprised me as I passed around a bend in the trail.</figcaption>
</figure>

<figure class="fullwidth">
  <img src="/img/blog/tmobile/yellowstone-3.jpeg" />
  <figcaption>Bunsen Peak, as seen from the Howard Eaton Trail.</figcaption>
</figure>

<hr />

<p>A week later, I finally said goodbye to Yellowstone. I then drove about 4 hours to Idaho Falls, Idaho, to take another routine Covid test, before continuing for another 3 hours to Sun Valley, Idaho, where I would ski with my dad and sister, who were joining me for the next week and a half. The drive went mostly along state highways again, which I was growing a liking to. Despite having little to no cell service for most of the drives, the scenery was much more interesting than what I had been observing from interstates.</p>

<p>As a result, I got to pass through towns like <a href="https://en.wikipedia.org/wiki/Arco,_Idaho">Arco, Idaho</a>, the world’s first community to be lit entirely by nuclear power. I learned that the state of Idaho is almost entirely flat, with the notable exceptions of the Rocky Mountains and the <a href="https://en.wikipedia.org/wiki/Menan_Buttes">Menan Buttes</a>. The buttes are two of the world’s largest volcanic tuff cones, which are essentially large rocks formed in the aftermath of a volcanic eruption. Despite their massive size, rising about 800 feet above the plains below, they only formed about 10,000 years ago, more recently than the first human migration into North America.</p>

<figure class="fullwidth">
  <img src="/img/blog/tmobile/menan-buttes.jpeg" />
  <figcaption>The <a href="https://en.wikipedia.org/wiki/Menan_Buttes">Menan Buttes</a> are two of the largest volcanic tuff cones in the world.</figcaption>
</figure>

<p>Some time later, I arrived in Sun Valley. As I was driving through the town, something felt off, but I couldn’t put my finger on what it was. And then it hit me: the street I was driving on had a bike lane. I hadn’t seen a bike lane since I was in Chicago, 2 weeks and 2,000 miles ago. I faintly recalled reading something about how, in the United States, the presence of bike lanes tends to correlate with how likely a town is to vote Democrat. I wondered if that would hold true for Sun Valley, considering Idaho’s status as a solidly red state.</p>

<p>Once I got to our motel, I looked it up, and sure enough, Sun Valley is the only part of Idaho that reliably votes Democrat. I found it interesting to see the correlation hold up in practice. Then, I checked my results.</p>

<figure class="fullwidth">
  <img src="/img/blog/tmobile/maps/map5.png" />
  <div class="legend">
    <div class="item">
      <div class="inline-color-line" style="background: #e6e6e6"></div>
      <div class="inline-label">Same as advertised</div>
    </div>
    <div class="item">
      <div class="inline-color-line" style="background: #ff968f"></div>
      <div class="inline-label">One ‘G’ worse</div>
    </div>
    <div class="item">
      <div class="inline-color-line" style="background: #c31f13"></div>
      <div class="inline-label">Two ‘G’s worse</div>
    </div>
    <div class="item">
      <div class="inline-color-line" style="background: #410101"></div>
      <div class="inline-label">Three ‘G’s worse</div>
    </div>
  </div>
</figure>

<p>Once again, the time I spent driving along state highways in Montana and the northeastern corner of Idaho was riddled with service that was worse than what T-Mobile had advertised in that area. After driving further into Idaho, service improved greatly, which is likely due, again, to Idaho’s mostly flat terrain.</p>

<p>We stayed in Sun Valley for the next 9 days. Sun Valley was a ski resort I will never forget, with excellent skiing conditions and a cute resort town. It remains the only place I have ever seen road signs that say, “No hunting within city limits,” which I thought was obvious, and “Sleigh crossing.” Highways surrounding the area often had tracks running alongside them for snowmobiles. The cherry on top was the view from the top of Bald Mountain, Sun Valley’s primary peak, likely the best I have ever seen from a ski mountain.</p>

<figure class="fullwidth">
  <img src="/img/blog/tmobile/sun-valley.jpeg" />
  <figcaption>View from the top of Bald Mountain, Sun Valley’s primary peak.</figcaption>
</figure>

<h2 id="lost-without-signal">Lost without signal</h2>

<p>A week later, I began my drive to Park City, Utah. I intentionally took a route that was slightly longer in order to avoid interstates and collect data from more remote areas. This turned out to be a blessing and a curse. As had been the case for the past few weeks along state highways, the drive was beautiful. However, as I had seen on my recent drives, the cell signal was much worse.</p>

<p>I eventually stopped for gas in Evanston, Wyoming, population 11,848. The only available network was 3G, likely from a T-Mobile partner, which allowed me to make phone calls and text messages, but prevented me from accessing the Internet. The last time I remembered having a data signal was over an hour ago. After filling up on gas, I continued driving south along my route which avoided major highways. It turns out there are no real highways south of Evanston, so my route went along unpaved, unnamed roads for the majority of the drive from here.</p>

<p>45 minutes outside of Evanston, Google Maps crashed. It had been an hour and a half since I had a signal, and about 35 minutes since I had seen another car. I panicked. I stopped the car to check my phone, and the route was gone. I was stunned. I tried zooming in on the map, seeing if I could piece together some roads that would eventually get me to Park City. No luck. Nothing would load. I was essentially lost in the middle of nowhere. It had been awhile since I had seen a sign indicating a mile marker or a nearby city, and the few signs that did exist were not very helpful. This part of Wyoming wasn’t designed for tourists.</p>

<figure class="fullwidth">
  <img src="/img/blog/tmobile/middle-of-nowhere.jpeg" />
  <figcaption>I later found out I was driving along “County Road 155.”</figcaption>
</figure>

<p>I eventually decided I would continue driving forward. Google Maps led me here, which meant the route to Park City had to be ahead. The roads around here were also very long and mostly straight. I figured if I used my phone’s compass to make turns that took me west, I would eventually find a highway. I hit the gas pedal.</p>

<p>Maintaining about 25 miles per hour along the unmarked, snowed-over dirt road, I continued ahead. I thought there was nothing in South Dakota, but I learned there’s even less in the southwestern corner of Wyoming. About 20 minutes later, I reached an intersection, marked by a sign with a road number that had been riddled with bullets. I decided to take a break and admire the fact that I was likely about as far from civilization as I had ever been. I hadn’t had cell service for two full hours, and it had been an hour since I had even seen another car.</p>

<figure class="fullwidth">
  <img src="/img/blog/tmobile/middle-of-nowhere-2.jpeg" />
  <figcaption>“No winter maintenance by authority of Uinta County commissioners.” Checks out.</figcaption>
</figure>

<p>It was very cold, so I didn’t stop for long. I turned west and continued making my best guesses at the turns I should take along Wyoming’s country roads.</p>

<p>About 25 minutes later, I finally saw the light at the end of the tunnel. Another intersection was coming up, but this one was different. The road ahead was paved. I turned west again and drove, hopeful that I would find service soon. Another five minutes passed before I finally spotted another car. A Ford F-150 that used to be a bright shade of red, but was covered in dirt and grime. A symbol of hope. I’m sure my car didn’t look much better.</p>

<p>I started glancing at my phone more frequently, hopeful that I would get a signal soon. About 10 minutes later, it finally came. I had 1 bar of signal, and I was connected to a 4G network. I stopped in the parking lot of a tiny local church and checked my phone. Where was I? Coalville, Utah. The service was painfully slow, but it was present, and that was all that mattered. I typed in my destination in Park City and loaded the route, with Google Maps’s “avoid highways” feature turned off. I was done with the adventure, at least for now. Around 10pm, I checked into my Airbnb and crashed. I was exhausted.</p>

<hr />

<p>The next morning, I woke up and brought my belongings inside. I had held onto several cooking supplies from the past few weeks, and to my surprise, the olive oil I had left in my car had frozen completely. I didn’t even know that was possible. The weather that morning had been in the single digits.</p>

<p>Once I was settled in, I opened my laptop and looked at my results from the previous day. If T-Mobile claimed I should have had reception along any part of the desolate 2.5-hour stretch of the previous day’s drive without cell service, I was ready to lose all hope in their coverage maps.</p>

<figure class="fullwidth">
  <img src="/img/blog/tmobile/maps/map6.png" />
  <div class="legend">
    <div class="item">
      <div class="inline-color-line" style="background: #e6e6e6"></div>
      <div class="inline-label">Same as advertised</div>
    </div>
    <div class="item">
      <div class="inline-color-line" style="background: #ff968f"></div>
      <div class="inline-label">One ‘G’ worse</div>
    </div>
    <div class="item">
      <div class="inline-color-line" style="background: #c31f13"></div>
      <div class="inline-label">Two ‘G’s worse</div>
    </div>
  </div>
</figure>

<p>As I had mostly expected by that point, T-Mobile advertised stellar coverage in the middle of nowhere. Most of the time I was lost, I had been in Uinta County, Wyoming, and Rich County, Utah, shaded in gold on the map above. In these two counties, T-Mobile advertised 4G and 5G service for the bulk of my drive, which went along Utah’s Highway 16, Wyoming’s Highway 89, and various unnamed country roads. However, my phone had either 3G or no service in every recording made within these two counties. Even when my phone did have 3G, it couldn’t connect to the Internet, which had prevented me from loading Google Maps.</p>

<figure class="morewidth">
  <img src="/img/blog/tmobile/uinta-rich.svg" />
</figure>

<p>According to T-Mobile’s map, I should have had Internet access through either a 4G or 5G connection for 72% of the time I was in these counties, and I should have had “Partner: 3G / 2G” coverage for about 13% of the time I was in Rich and Uinta counties. Instead, I experienced 3G coverage without data 75% of the time I was there, and no service for the remaining 25%.</p>

<p>To add insult to injury, T-Mobile doesn’t provide many details about what the “Partner: 3G / 2G” level of coverage even entails. In these areas, the map comes with a disclaimer: “Coverage is provided by partners in these areas, so speeds and connections may vary.” Even if I had looked at the coverage map in advance of my trip, I had no way to know in advance that this specific variety of partnered coverage came with calls and texts, but no data connection. Oh well.</p>

<hr />

<p>Park City featured, without a doubt, the best skiing conditions I have ever seen. Shortly after I arrived, a major snowstorm hit the region, dumping over a foot of fresh snow on the slopes. My Airbnb lost power, but the ski slopes were open. I was ready.</p>

<figure class="fullwidth">
  <img src="/img/blog/tmobile/park-city-1.jpeg" />
  <figcaption>View from the top of the “P-Zone” trail in Park City. After finishing this trail, I got stuck waist-deep in powder on my way out.</figcaption>
</figure>

<figure class="fullwidth">
  <img src="/img/blog/tmobile/park-city-2.jpeg" />
  <figcaption>McConkey’s Bowl, one of many bowls on Park City’s Jupiter Peak, during a snowstorm.</figcaption>
</figure>

<p>I originally planned to stay in Park City for one week, but after a few days of skiing, the conditions were so good that I decided to extend my reservation for another week. I’m sure it’ll be awhile before I find conditions that come even close.</p>

<hr />

<p>My next and final stop was Vail, Colorado. I planned to pick up two friends from Denver International Airport and then drive two hours back to Vail, where we would stay for a week and a half. I chose to avoid interstates again for part of the way to Denver, which once again did not disappoint. Fortunately, this route stuck to paved state highways instead of middle-of-nowhere dirt roads. However, even the parts of the drive that did go along major highways were incredible. I-70 from Vail to Denver goes through a valley that offers spectacular views during the day.</p>

<figure class="fullwidth">
  <img src="/img/blog/tmobile/maps/map7.png" />
  <div class="legend">
    <div class="item">
      <div class="inline-color-line" style="background: #5cd6ff"></div>
      <div class="inline-label">One ‘G’ better</div>
    </div>
    <div class="item">
      <div class="inline-color-line" style="background: #e6e6e6"></div>
      <div class="inline-label">Same as advertised</div>
    </div>
    <div class="item">
      <div class="inline-color-line" style="background: #ff968f"></div>
      <div class="inline-label">One ‘G’ worse</div>
    </div>
    <div class="item">
      <div class="inline-color-line" style="background: #c31f13"></div>
      <div class="inline-label">Two ‘G’s worse</div>
    </div>
  </div>
</figure>

<p>Once again, my experienced coverage was worse than advertised for most of the drive. However, for half an hour before merging onto I-70 to Denver, I actually experienced coverage that was better than advertised: 4G service was advertised in this entire region, highlighted in blue on the map above, but I had 5G service almost the entire time. This would remain the only time where my coverage was better than advertised for more than a couple minutes during the entire roadtrip.</p>

<p>It was great to ski with friends again after spending two weeks in Park City on my own, and once again, the conditions were great. Before this roadtrip, I had never skied in the Rockies. Sun Valley, Park City, and Vail absolutely did not disappoint.</p>

<figure class="fullwidth">
  <img src="/img/blog/tmobile/cool-snowboarder.jpeg" />
  <figcaption>Me near the top of a trail in Vail’s Blue Sky Basin. At Vail, I opted for a snowboard instead of skis.</figcaption>
</figure>

<p>Unfortunately, all good things must come to an end. All three of us are MIT students, and our spring semester was set to begin on February 16, which eventually meant it was time to go. One of my friends, Julia, chose to accompany me on the drive home, which we decided we wanted to complete in 2 days. Despite the shortest route from Vail to Boston taking 30 hours to drive, Julia agreed to my plan to route along state highways for most of the drive, which would increase our trip’s duration to 36 hours. In 2 days. She, too, was a dissatisfied T-Mobile customer.</p>

<p>Leaving Vail meant the end of enjoying beautiful views along state highways. Shortly after dropping our other friend off at Denver’s airport, we crossed the border from Colorado into Kansas, which quickly became my least favorite state. It felt like it never ended. Rolling hills as far as the eye could see in every direction, with nothing but farmland surrounding us. The only notable feature I remember from this part of the trip was when we passed a sign marking the Geographic Center of the United States. After what felt like an eternity, we checked into our Airbnb in Lafayette, Indiana around 3am. At 19 hours, it was the longest I had ever driven in one day.</p>

<hr />

<p>We woke up around 10am and set off for the last time. I got another routine Covid test at a Walgreens in Kokomo, Indiana, and then we navigated along the shortest route to Boston. After such a long drive the day before, neither of us was in the mood to prolong our journey.</p>

<p>Finding activities to pass the time proved difficult, as the day before had already exhausted all of the songs we wanted to listen to and roadtrip games we could come up with. We decided to listen to Jerry Seinfeld’s audiobook, “Is This Anything?,” a six-hour collection of one-liners and whimsical anecdotes that comprise the best material he had come up with over his entire career. Seinfeld is good, but it also got old quickly. We didn’t have much else to do. We eventually crossed the border into New York, and then into Massachusetts, before finally arriving in Boston at 3am, 17 hours after we departed from our Airbnb. I had been behind the wheel for 36 of the past 43 hours. I was ready to leave my car parked for the next month.</p>

<p>And yet, in my state of exhaustion, I was filled with a feeling of awe at the vastness of the country I had spent my life in. For all of the 21 years I have been alive, I have lived in New York City and Boston. I’ve visited some other major cities around the United States, but just six weeks earlier, I had never been on a roadtrip. The trip gave me an excuse to visit so many new and interesting places, but I had still skipped a majority of the country, making basically no stops on my way back from Vail, or even touching the western or southern parts of the country. I promised myself I’d go on another crazy roadtrip someday.</p>

<p>But let’s not get distracted: the real fruits of my labor were finally ready to harvest. I now had 7,000 miles of data that I could finally use to answer the question that started it all: Does the T-Mobile coverage map depict real-world data? Or are they openly lying to unsuspecting potential customers? I checked the results of my drive back from Vail before diving into the data.</p>

<figure class="fullwidth">
  <img src="/img/blog/tmobile/maps/map8.png" />
  <div class="legend">
    <div class="item">
      <div class="inline-color-line" style="background: #e6e6e6"></div>
      <div class="inline-label">Same as advertised</div>
    </div>
    <div class="item">
      <div class="inline-color-line" style="background: #ff968f"></div>
      <div class="inline-label">One ‘G’ worse</div>
    </div>
    <div class="item">
      <div class="inline-color-line" style="background: #c31f13"></div>
      <div class="inline-label">Two ‘G’s worse</div>
    </div>
    <div class="item">
      <div class="inline-color-line" style="background: #410101"></div>
      <div class="inline-label">Three ‘G’s worse</div>
    </div>
  </div>
</figure>

<p>The results were pretty similar to what I had previously seen in the Midwest. Despite exceptions in a few locations, they largely matched T-Mobile’s advertisements, which can again likely be attributed to the flat terrain west of the Rockies. Now that I’ve processed all my driving results, we can look at a deeper analysis.</p>

<h2 id="results">Results</h2>

<p>The first question I wanted to answer was simple: on average, does T-Mobile exaggerate its coverage? Considering I had only found one region, in Colorado, where my coverage was better than advertised, I already had a hunch about what the answer would be.</p>

<figure class="lesswidth">
  <img src="/img/blog/tmobile/road-service.svg" />
</figure>

<p>We can see above that my service was worse than advertised 33% of the time. My service was also better than advertised 3% of the time—most of these instances were one-off and didn’t appear on the maps because they would only happen for a brief moment. However, when my coverage was worse than advertised, it would often persist for at least several minutes.</p>

<p>I also wanted to follow up on my earlier analysis of service on interstates versus other highways by performing the same analysis for my entire roadtrip.</p>

<figure class="lesswidth">
  <img src="/img/blog/tmobile/highways-all.svg" />
</figure>

<p>As I had expected, T-Mobile’s claims hold less water when you leave interstate highways. It’s important to note that it’s not just that the quality of service is worse off of interstates, which should be expected, but that T-Mobile’s claims are more exaggerated off of interstates. In other words, people who live in more remote parts of the country are more likely to be deceived by T-Mobile’s coverage map. Not good.</p>

<p>The last question I wanted to answer was about T-Mobile’s claims of nationwide 5G. T-Mobile has, for years, claimed they are a leader in 5G coverage. Their homepage currently claims they have “more 5G bars in more places,” and they claim to have deployed the <a href="https://www.t-mobile.com/news/press/americas-first-nationwide-5g-network">first nationwide 5G network</a>.</p>

<figure class="lesswidth">
  <img src="/img/blog/tmobile/nationwide-5g.svg" />
</figure>

<p>However, their advertised service quality exceeds what I should have observed on my roadtrip. Despite advertising that I should have received a 5G signal 77% of the time, I only observed 5G 52% of the time. Most of the time, this was replaced with a 4G signal, but occasionally I had either a 3G signal or no service in these areas as well.</p>

<p>With these results, I had essentially confirmed the suspicions I had all along. Not only is T-Mobile’s map misleading in general, but it is also more misleading in more remote locations. This hurts me as a customer who enjoys hiking and skiing, often in remote, mountainous regions of the country, who wants to make sure I’ll have service when making plans. It also hurts the people who live in these more remote areas, who are more likely to rely on a cell signal as their primary Internet connection.</p>

<hr />

<p>To make sense of these results, I called Corey Chase, a telecommunications infrastructure specialist with Vermont’s Department of Public Service who made headlines in 2019 when <a href="https://www.npr.org/2019/02/01/690071045/one-mans-quest-to-prove-vermont-has-terrible-cell-service">he spent six weeks driving all over Vermont to prove coverage maps were misleading</a> within the state.</p>

<p>I started the interview with one question: “AT&amp;T identifies cost as one of the major roadblocks to collecting more coverage data. Do you believe this is accurate?”</p>

<p>This would turn out to be the only question I needed to ask: for the next 15 minutes, Chase explained everything I would have wanted to know about coverage data. “Every major cell phone company does drive tests of every major road every 6 months.” He continued, “They know exactly what service is where. They don’t want to talk about this.”</p>

<p>As it turned out, his project was powered largely by volunteers, who were happy to drive circles around Vermont if it might eventually improve their cell signal. In total, Chase said it took about 6 weeks and $3-5k to record cell phone data from all of Vermont’s major roads and many of the state’s less-traveled roads. Almost all of the money was spent buying new phones used to collect the coverage data. Chase speculated that with used phones, the project would have cost just $600, spent on a web server to store the results and the coverage plans from each major carrier. He added, “It’s ridiculous that anyone would say it’s too expensive to do this.”</p>

<p>During the interview, I was shocked to learn about the routine data collection done by carriers. If these data were fed back into the carriers’ coverage maps, I should have observed results that were much more in line with what T-Mobile publishes on their website. When asked to respond to the findings presented in this story, Armando Diaz, a spokesperson for T-Mobile, wrote back, “We stand by the accuracy of our maps,” without elaborating or addressing my results further.</p>

<p>I was also shocked by Chase’s kindness throughout the interview, and his willingness to talk to me, someone who is not a journalist, doesn’t even live in Vermont, and was mostly doing this project to satisfy my own curiosities. At the end of our chat, I made sure to thank him for his time, to which he replied, “Of course. Anything we can do to get better coverage.”</p>]]></content><author><name></name></author><summary type="html"><![CDATA[The results probably won’t surprise you.]]></summary><media:thumbnail xmlns:media="http://search.yahoo.com/mrss/" url="https://jackcook.com/img/blog/tmobile/maps/cover.png" /><media:content medium="image" url="https://jackcook.com/img/blog/tmobile/maps/cover.png" xmlns:media="http://search.yahoo.com/mrss/" /></entry><entry><title type="html">Organizing the first virtual HackMIT</title><link href="https://jackcook.com/2020/10/20/virtual-hackmit.html" rel="alternate" type="text/html" title="Organizing the first virtual HackMIT" /><published>2020-10-20T00:00:00+00:00</published><updated>2020-10-20T00:00:00+00:00</updated><id>https://jackcook.com/2020/10/20/virtual-hackmit</id><content type="html" xml:base="https://jackcook.com/2020/10/20/virtual-hackmit.html"><![CDATA[<p>I just want to preface this blogpost by acknowledging that I would not be where I am today if it weren’t for collegiate hackathons. Despite declining hackathon sponsorship over the last several years, I think it is paramount that tech companies and universities continue to support these events.</p>

<p>My first hackathon was <a href="https://2014.hackthenorth.com">Hack the North</a>, back in 2014. I built <a href="https://github.com/jackcook/Droidboard">Droidboard</a>, a Python script that converted iOS storyboard files into functioning Android apps. No sponsor was interested in recruiting a high school freshman, but I remember being blown away by the people I met, the mentorship I received, and the swag and food I enjoyed throughout the weekend. In fact, I was so hooked by Hack the North that I attended 21 other collegiate hackathons in the 2014-2015 season, and I’m still in touch with the friends I made at Hack the North and several other hackathons I attended over six years ago. Through repeatedly building small projects at weekend-long hackathons, I eventually went on to win second place at <a href="http://www.hackgeny.com/events/siliconvalley/">Hack Gen Y</a>, third place at <a href="https://2015.mchacks.ca">McHacks 2015</a>, and first place at <a href="https://hackny-s2016.devpost.com/project-gallery">HackNY Spring 2016</a>.</p>

<p>Without these hackathons, I would not have made the lasting connections or learned the skills necessary to succeed in the computer science industry, which is why it is so important that these events continue to thrive. My overwhelmingly positive experience drove me to want to share hackathons with my peers, because I think these events should be readily accessible to anyone who is interested in computer science. I started my own <a href="http://atomhacks.org">hackathon</a> in high school, and luckily, for the past two years, I’ve had the pleasure of being part of the HackMIT organizing team.</p>

<figure>
<img src="/img/blog/virtual-hackmit/hackmit-johnson.jpg" />
<figcaption>Hackers building projects during HackMIT 2019.</figcaption>
</figure>

<p>The first year and a half of my time on the team was super exciting, and also mostly what I had expected. I made a bunch of new friends, I helped organize <a href="https://blueprint.hackmit.org/2019/">Blueprint 2019</a>, <a href="https://archive.hackmit.org/2019/">HackMIT 2019</a>, and <a href="https://blueprint.hackmit.org">Blueprint 2020</a>, and I became a co-director in the spring of my freshman year. I helped put together an awesome line-up of speakers, reimbursed the travel of the hundreds of hackers who traveled to Boston, and did a bunch of other things along the way.</p>

<p>You probably know what’s coming next.</p>

<p>Around the beginning of March, everyone started discussing this virus that was spreading through China and Italy. We didn’t know it yet, but literally <em>everything</em> was about to change. To the best of my memory, here’s a timeline of how we realized a physical HackMIT was not going to happen in 2020. If you already know the whole story, feel free to <a href="#hackmit">skip to the bottom</a>.</p>

<ul>
  <li>(Feb. 9) We finish organizing Blueprint 2020</li>
  <li>(Feb. 16) I attend TreeHacks with a few other HackMIT organizers. Palo Alto was a nice warm escape from the Boston winter. Life at this point is still extremely normal.</li>
  <li>(Mar. 5) Two significant events take place:
    <ul>
      <li>Three Biogen employees test positive for COVID-19 following a 175-person meeting in Boston <a href="https://www.wcvb.com/article/workers-who-attended-boston-biogen-meeting-test-positive-for-coronavirus/31252079#">[source]</a>. This was probably one of the first reports of cases in Boston, at least as far as I can remember.</li>
      <li>That same evening, MIT sends the first of many emails to the student body. Among other things, it says, <strong>“Effective immediately, if you are planning any in-person MIT event with more than 150 attendees, […] you must postpone, cancel, or ‘virtualize’ it.”</strong> <a href="/img/blog/virtual-hackmit/mit-first-covid-email.pdf">[source]</a></li>
      <li>I realize we were very lucky to have chosen a weekend in February for Blueprint, and not a weekend in March. I bet TreeHacks was also glad their event took place in mid-February.</li>
      <li>Everyone slowly realizes that CPW, the weekend in which we invite the accepted students to campus, would be cancelled. Ring delivery, senior prom, graduation, and other usual events aren’t looking so great either.</li>
    </ul>
  </li>
  <li>(Mar. 8) We wrap up spring recruitment for HackMIT, as we would in any other year. Everyone is talking about the virus, but it still feels a little distant.</li>
  <li>(Mar. 9) We have our first HackMIT general meeting with our new team members. We didn’t know this yet, but this would be our last in-person team meeting for a very long time. It remains the only time that many of our newest team members have ever met the rest of us in person.</li>
  <li>(Mar. 10) This was probably the craziest day of them all:
    <ul>
      <li>(8:25am) I receive a long and scary email from Harvard (I was cross-registered last semester). It says that all classes will be instructed virtually starting on March 23, and that students would not be returning to campus after spring break, which was next week for Harvard. <a href="/img/blog/virtual-hackmit/harvard-covid-email.pdf">[source]</a></li>
      <li>(8:45am) I bike over to Harvard to take my Harvard class. By the I got to the classroom, everyone had seen the email, and everyone was talking about it. Multiple people who were traveling abroad for spring break didn’t know whether or not to cancel their plans. I have literally no idea what we learned that day.</li>
      <li>(some time later in the morning) Screenshots of notes of conversations various students were having with MIT’s administration begin circulating among MIT students. Rumors and gossip spread for the entire day. Nobody is getting work done, and nobody knows what’s going on.</li>
    </ul>
    <figure>
<img src="/img/blog/virtual-hackmit/slack-message.png" />
<figcaption>A message sent by a previous HackMIT organizer in our Slack workspace.</figcaption>
</figure>
    <ul>
      <li>(5:02pm) MIT finishes composing their email and sends it to everyone. Classes are cancelled for the week of Mar. 16-20, and students must leave campus by March 17. <a href="https://covid19.mit.edu/update-from-president-l-rafael-reif-to-the-mit-community">[source]</a></li>
      <li>Everyone is pretty shell-shocked. People start saying goodbye and figuring out where to store their things. Seniors realize the next few days may be their last time seeing many of their classmates.</li>
    </ul>
  </li>
  <li>(Mar. 11) Zidane Abubakar, a former MIT student, snaps <a href="/img/blog/virtual-hackmit/killian-party.jpg">a photo of students gathering at Killian Court</a>, with one person holding one of the hand sanitizer stations that had appeared all over campus a few days earlier. The photo becomes <em>iconic</em>.</li>
  <li>(Mar. 12) Goodbyes continue. At 10:45pm, MIT announces that they will reimburse an additional $500 per student to change travel reservations such that they can leave campus by Sunday, March 15. <a href="/img/blog/virtual-hackmit/mit-covid-email-3.pdf">[source]</a></li>
  <li>(Mar. 13) I finish packing up all of my things and leave campus late at night. I had originally planned to leave on March 16.</li>
  <li>(Mar. 15) MIT announces that all classes will adopt a pass/no record grading policy, meaning that letter grades will not appear on your transcript. <a href="/img/blog/virtual-hackmit/mit-covid-email-4.pdf">[source]</a></li>
  <li>Classes don’t continue until March 30. Everyone spends the extended spring break quarantining at home, nervously watching COVID-19 counts rise, and comprehending what had just happened.</li>
  <li>(Apr. 27) It becomes clear that the pandemic is not improving in the U.S. at the same rate it is improving in other countries. We make the call to plan for a fully virtual HackMIT.</li>
</ul>

<p>When I started writing that timeline, I honestly didn’t expect it to get as long as it did (sorry!). Thinking back on it, I can’t believe how quickly things changed. On March 4, everything was basically normal. On March 5, there were a couple COVID-19 cases in Boston, and large events were cancelled, but everything was still pretty normal. Just five days later, we were told to leave campus as soon as possible. Isn’t it crazy that face masks didn’t even become commonplace until later in April? And now, 7 months later, we have a slightly better understanding of how the virus spreads and what its effects are, but the pandemic still presents an enormous issue across the country. I feel that I’m making the best of our time apart, but everything has become more difficult, and I have no idea when I should expect things to return to normal.</p>

<h2 id="hackmit">HackMIT goes virtual</h2>

<p>Anyway, back to HackMIT. On March 5, one of our former team members, Gonzo, wrote the following Facebook post:</p>

<figure>
<img src="/img/blog/virtual-hackmit/gonzo-post.png" />
<figcaption>Gonzo, and many other members of the MIT community, start to brainstorm how we can replace CPW.</figcaption>
</figure>

<p>This was the same day we received the email from MIT about large events being cancelled, when everyone collectively realized that CPW (campus preview weekend) would be rendered impossible. A few days later, I realized that if HackMIT had to go virtual as well, this proposed “Club Penguin” approach could probably work for us as well. I knew that I probably had the skills needed to build this thing, and I knew that it would probably be the best way for us to enjoy the virtual format. Gonzo deserves full credit for planting this seed in my head.</p>

<p>Two months later, on April 27, we made the call to plan for a virtual HackMIT. I knew I wanted to build this platform, which would affectionately become known as “Hack Penguin.” However, there were a couple problems that I didn’t really see coming: our upcoming virtual event had basically no precedent, and I had no idea how to lead a big project.</p>

<p>Let’s focus on the first problem for a second. By the time we made the call to go virtual, we realized that some parts of our event would stay mostly the same, and some parts of the event would have to change dramatically. For example, in a virtual hackathon, there is no food, there are no travel reimbursements, and there are no venues to reserve. Soon enough, there will be nobody on our team who has done these things before, but that’s a separate problem. Some of the tasks that are kept in a virtual format include speakers, scheduled mini-events, sponsors, and prizes. I was on point for speakers, and this becomes a significantly easier task when you don’t need to convince your speakers to travel to Boston. We had an incredible line-up this year, featuring the founders of companies such as Duolingo, GitHub, and 23andMe.</p>

<p>Prizes is a good example of a task that stays roughly the same. In a virtual format, we still need to mail things out to our winners. Sponsorship is a good example of a task that becomes significantly more difficult. Many of our previous sponsors were quickly losing revenue as consumer spending plummeted during the pandemic, and this led to many companies cutting back on recruiting or eliminating hackathon sponsorship from their budgets entirely. Companies such as Airbnb, Uber, and Boeing still have a long and uncertain road to recovery ahead. As we got closer to the summer, websites such as <a href="https://ismyinternshipcancelled.com">ismyinternshipcancelled.com</a> popped up to track which companies had cancelled their summer internship programs, which likely meant they wouldn’t be recruiting this fall. It also became more difficult to convince companies that hackathon sponsorship was still worthwhile when they couldn’t interact with our hackers in person.</p>

<p>When we looked at these challenges, we naturally wondered if anyone had solved these problems before. Unfortunately, there wasn’t really anything that we could compare our situation to. Some hackathons, such as <a href="https://lahacks.com/live">LAHacks (UCLA)</a> and <a href="https://www.hoohacks.io">HooHacks (UVA)</a>, had to quickly move to a virtual format in the spring, but they didn’t have several months to plan this transition like we did. Other hackathons, such as <a href="https://hacknow.calhacks.io">hack:now (UC Berkeley)</a> and the <a href="https://hack-at-home.devpost.com">MLH Summer League</a> were always intended to be virtual events, but these weren’t great parallels either, because anyone could sign up and participate in these events, whereas we decided early on that we wanted to keep our admissions process to ensure we could provide everyone with judges, mentorship, and swag. This all meant that we didn’t have a lot of precedent. We were probably going to become the one of the first major virtual collegiate hackathons that had several months to prepare their event.</p>

<p>The second problem of project management was also a little tricky. I was now HackMIT’s older co-director, and I was excited about starting the Hack Penguin project, but it turned out I had no idea how to do this. I’m decidedly not a natural leader, and while organizing HackMIT 2019, I relied on my older co-director, Jessica Sun, and my logistics director, Kye Burchard, a lot more than I originally realized. They filled in the communication gaps and random things I had missed in the planning process, and ensured that everything went smoothly on the day of our event. In my mind, I could clearly envision the end goal of this platform: a place where hackers could walk around, talk to each other, talk to our sponsors, and explore. However, I knew I wouldn’t be able to do this alone, and I originally struggled with communicating all of this to our team. I spent a large chunk of the summer organizing meetings to discuss various aspects of the platform and getting better at dividing the work that needed to be done into tasks that I could assign out to members of our team. Over the summer, I could feel myself getting better at project management, and I’m very happy with how things ended up. But I definitely struggled with this a lot.</p>

<h2 id="hack-penguin-comes-to-life">Hack Penguin comes to life</h2>

<p>We decided that we had two major goals with Hack Penguin. First, we wanted to provide a unique way for everyone to stay connected while we were all apart. Second, as (probably) one of the first events of our kind, we wanted to build something that was unique and memorable, in a way that would make our event stand out. We devoted a lot of time and effort into the platform, and put a ton of thought into each feature that went into it.</p>

<p>On May 25, I finished up the first (very rough) working demo of Hack Penguin. Two computers could connect to a shared backend server, and watch each other walk around the screen. That’s all that you need for a hackathon, right?</p>

<video controls="" src="/img/blog/virtual-hackmit/hack-penguin-demo-1.mp4" type="video/mp4" class="portrait"></video>

<p>The project progressively picked up speed over the summer. Here’s a video from mid-August:</p>

<iframe width="560" height="315" src="https://www.youtube.com/embed/6wENSWlq9IM" frameborder="0" allow="accelerometer; autoplay; clipboard-write; encrypted-media; gyroscope; picture-in-picture" allowfullscreen=""></iframe>

<p>Here’s one from late August:</p>

<video controls="" src="/img/blog/virtual-hackmit/hack-penguin-demo-2.mp4" type="video/mp4" class="portrait"></video>

<p>Here’s one from just a few days before our event:</p>

<video controls="" src="/img/blog/virtual-hackmit/hack-penguin-demo-3.mp4" type="video/mp4" class="portrait"></video>

<p>And here are a few screenshots from throughout the weekend:</p>

<figure>
<img src="/img/blog/virtual-hackmit/hack-penguin-1.png" />
<figcaption>Hackers spawn in the "town square" at the end of our closing ceremony.</figcaption>
</figure>

<figure>
<img src="/img/blog/virtual-hackmit/hack-penguin-2.png" />
<figcaption>Hackers get inspired by our partnering nonprofits.</figcaption>
</figure>

<figure>
<img src="/img/blog/virtual-hackmit/hack-penguin-3.png" />
<figcaption>Hackers go to the "Hacker Plaza" to find our arcade, coffee shop, and more.</figcaption>
</figure>

<figure>
<video controls="" src="/img/blog/virtual-hackmit/hack-penguin-4.mov" type="video/mov"></video>
<figcaption>Hackers having fun, I can only assume.</figcaption>
</figure>

<p>I’ll probably write a separate post on more technical details about Hack Penguin, but in the end, our team designed and built an online isometric MMO-esque platform that had an enormous array of features, including:</p>

<ul>
  <li>A “sponsor town” where each company had their own building, and hackers could enter buildings to talk to sponsor representatives</li>
  <li>33 different rooms for hackers to explore, along with a bunch of hidden “easter eggs” and objects to interact with in each room</li>
  <li>Tents for each of our partnering nonprofits, featuring a variety of sources of inspiration for potential hackathon projects</li>
  <li>A mall with a fitting room where you could customize your character by changing the colors of your character’s skin and clothing</li>
  <li>A coffee shop with a world map, where hackers could pin where they were from</li>
  <li>An arena that hackers could join for “peer expo,” during which hackers met each other and learned about each other’s projects.</li>
  <li>The “jukebox,” where hackers could suggest songs that everyone would listen to together in real-time</li>
  <li>A custom 3D character model with 6 different dance moves that could be performed at any time</li>
  <li>A virtual version of TIM the beaver, our school’s mascot, that walked around and said things at random</li>
  <li>10 different achievements for hackers to earn by participating in various parts of our event</li>
  <li><a href="https://github.com/hackmit/playground">also we open sourced the whole thing!</a></li>
</ul>

<p>I am honestly floored by how much work we got done over the summer, and the project could not have been completed without the collective work of <a href="https://github.com/hackmit/playground#credits">20(!) members of our team</a> who made significant design and development contributions over the summer, along with everyone else on our team who planned all of the parts of our event. Our marketing and design team especially deserves a ton of credit considering that most of them had no experience with game design or isometric design at the start of the project! Despite the virtual format, we managed to ship HackMIT-branded swag to almost all of our hackers, judge every submitted project within a 2-hour time period on Sunday morning, and much, much more. I’m going to miss organizing HackMIT, and I can’t wait to see what the team puts together for HackMIT 2021. I can only hope they’ll be able to hold it on MIT’s campus.</p>

<p>Also, if you’re a hackathon organizer who needs any tips on planning a virtual hackathon, <a href="mailto:hello@jackcook.com">please get in touch with me</a> or <a href="mailto:team@hackmit.org">with our team</a>!</p>]]></content><author><name></name></author><summary type="html"><![CDATA[Once we realized there would be no way for HackMIT to take place on MIT's campus in 2020, we had a lot of work to do.]]></summary><media:thumbnail xmlns:media="http://search.yahoo.com/mrss/" url="https://jackcook.com/img/blog/virtual-hackmit/playground-dabbing.png" /><media:content medium="image" url="https://jackcook.com/img/blog/virtual-hackmit/playground-dabbing.png" xmlns:media="http://search.yahoo.com/mrss/" /></entry><entry><title type="html">My week with Hack Lodge Boston</title><link href="https://jackcook.com/2019/02/16/hacklodge.html" rel="alternate" type="text/html" title="My week with Hack Lodge Boston" /><published>2019-02-16T00:00:00+00:00</published><updated>2019-02-16T00:00:00+00:00</updated><id>https://jackcook.com/2019/02/16/hacklodge</id><content type="html" xml:base="https://jackcook.com/2019/02/16/hacklodge.html"><![CDATA[<p>At MIT we have a pretty long winter break, which is designed to give us a lot of freedom with how we spend our time. Some students take on <a href="https://alum.mit.edu/slice/mit-externship-program-full-time-work-short-term-placement-and-long-term-benefits">short internships</a>, hang out on campus with friends, or even <a href="http://misti.mit.edu/global-teaching-labs">teach classes abroad</a>. I decided to spend my last week of IAP with Hack Lodge Boston (HLB), a week-long hackathon held off-campus with a bunch of other MIT students. Here’s how it went.</p>

<h2 id="sunday">Sunday</h2>

<p>After sleeping through my alarm (as usual), I eventually woke up, excited for the week ahead. I don’t pack for <em>anything</em> in advance, so I quickly put seven days of clothes into my duffel bag, brushed my teeth, and walked to the nearest bus stop. Half an hour later, I arrived at the hack lodge.</p>

<figure>
<img src="/img/blog/lodge.jpg" />
<figcaption>We got a whole townhouse to ourselves!</figcaption>
</figure>

<p>HLB was held in a 4-story townhouse with enough beds, kitchens, and workspaces to host about 25 people. After stepping inside, I claimed my bed before heading upstairs for our first standup. Since nobody had created anything yet, we spent the time introducing ourselves, assigning chores (e.g. cooking, cleaning up), and discussing how the week was going to unfold. Once the standup was over, we broke off into teams and got to work.</p>

<p>Most of the HLB participants came with their teams and ideas already prepared. My team had met up a couple days earlier, so we already knew each other’s names and had figured out our general idea. Here’s our pitch: MIT students use email extensively. In order to advertise events to the student body, people “dormspam” to the whole student body, effectively sending an email to 4,500 students. Anybody is allowed to dormspam, which means that everyone who is subscribed can receive upwards of 25-30 emails per day. As a result, many students unsubscribe from dormspam emails, and are shut off from event advertisements completely.</p>

<p>There has to be a better way. We decided we were going to scrape dormspam emails to try to find event details, and display these on a calendar, on a website that’s simple and easy for all MIT students to use. Furthermore, any student would be able to log into our site and configure the types of emails they’re interested in, and we would send them a personalized digest every day or so, listing the emails that went out to dormspam. This solves a couple of problems with the existing system, and allows everybody to stay in the loop without having to manage a crowded inbox. We were excited not only to solve the technical challenges with our hack, but also to build something that could be useful for the MIT community at large.</p>

<p>We started by loosely splitting up into two teams: frontend and backend. I was on the frontend team, and we spent the first hour designing the app. We chose to implement it with React, since I had a little experience with it, and my teammates wanted to learn more about it. We worked for a few more hours, until dinner arrived and our first speaker came to HLB. Kelly Peng, CEO of <a href="https://www.crunchbase.com/organization/aurora-tech-inc">Kura Technologies</a>, talked about her experience building an augmented reality startup, how she spends her free time, and what she’s looking forward to in the future.</p>

<p>After her talk, we got back to work. By the end of the night, this was what we had made!</p>

<figure>
<img src="/img/blog/screenshot.png" />
</figure>
<!-- ![](/img/blog/screenshot.png) -->

<h2 id="monday">Monday</h2>

<p>My bed is right next to a window that faces the sunrise, which made it much easier to wake up here than in my dorm room. I woke up at 9am (without my alarm!) so I could shower help cook breakfast. We made lots of bacon and scrambled eggs, and in the process we set off the fire alarm, which conveniently woke everyone up in time for standup.</p>

<p>During standup, everybody discussed what they finished yesterday, and their goals for today. It was a good way for us to keep track of our progress. We worked a bit more until burritos arrived for lunch, and we started talking to people on the other teams. I got a chance to get to know some of the other teams’ members, which in my mind was one of the best parts of HLB. After that, we worked some more until dinner, for which we cooked pasta.</p>

<p>After dinner, we had a team meeting where we figured out where everyone was in terms of their progress, and what needed to be done in order to prepare for tomorrow’s demo. We worked on our website’s login feature for a bit until someone brought out a Nintendo 64 emulator, and everyone started playing N64 Smash.</p>

<h2 id="tuesday">Tuesday</h2>

<p>Like yesterday, this morning I woke up around 9am to cook breakfast. Today we made pancakes, and they came out pretty well!</p>

<figure>
<img src="/img/blog/pancakes.jpg" />
</figure>

<p>We went through standup again, and quickly got to work. Today was our first demo day, which meant that at 10pm, each team would present what they had in front of everyone else. I spent most of my morning figuring out a bug that was caused by one missing line in my code. After lunch arrived, I realized that another one of my favorite things about HLB was that breaks were actually <em>encouraged</em>. Most hackathons are super tiring; you’re encouraged to eat junk food and pull an all-nighter to finish your project in time for demos on Sunday morning. By contrast, during HLB everyone ate well, slept well, and occasionally exercised. This was great for staying motivated for a whole week.</p>

<p>Eventually poké bowls arrived for dinner, and we talked some more to the other HLB participants. We had a quick team meeting to prepare for our demo, and kept working until we had something to present. I’m not sure what I was expecting to get out of our first demo night, but I definitely was not disappointed. From a working cardboard piano to a hilarious BAC tracker, everyone seemed to have a great time sharing progress on our projects. Afterwards, we had another Smash tournament, and I eventually called it a night.</p>

<h2 id="wednesday">Wednesday</h2>

<p>I overslept. Our team used today as a bit of a break, since a couple of us had meetings and other commitments back on MIT’s campus. During lunch, we all had a very long discussion about high school! All of us had very different experiences growing up, from international schools, to boarding schools, to public schools (<a href="https://bxscience.edu">like me</a>). After lunch, Abhi, one of the HLB organizers, gave a quick talk about the state of machine learning research. Our team worked for a bit after Abhi’s talk, but eventually I had to head back to campus for awhile. Over my winter break, I took a weekly four-hour rock climbing class to fulfill one of my PE credits.</p>

<p>Unfortunately, this meant I had to miss tonight’s talk on startups from Ben Jun, the CEO of HVF Labs. I got dinner on campus with a couple of friends, headed back to the hack lodge, worked for about an hour, and went to sleep.</p>

<h2 id="thursday">Thursday</h2>

<p>I woke up and made it to standup on time, and proceeded to work through most of the day. After lunch, Michael (one of my teammates) gave a talk on <a href="https://common-lisp.net">Lisp</a> and the <a href="https://rosettacode.org/wiki/Y_combinator">Y combinator</a> (unrelated to the <a href="https://www.ycombinator.com">VC firm</a>). We then coded some more, continuing to work through dinner because tonight was our second demo day.</p>

<p>After dinner, Stan Reiss from Matrix Partners gave a talk about the startup world from the perspective of a VC firm. It was pretty insightful for us, as students who mostly had experience building things, not selling them. After Stan’s talk, we worked for another hour before demos. Everyone made a ton of progress; it’s shocking how quickly you can get things done when you’re working with friends. We wrapped up our night with another team meeting, during which we figured out what was left to be done before final demos on Saturday.</p>

<h2 id="friday">Friday</h2>

<p>I woke up in time for standup again, and we immediately got to work. Today was our last day working as a full team, since three of our team members had weekend commitments that meant they had to leave the hack lodge tonight. We ordered Bertucci’s for lunch, and then listened to a talk by <a href="http://czeng.org">Catherine Zeng</a>, another HLB participant, about her experience building <a href="http://lambdatea.com">a startup</a> and taking it through Y Combinator.</p>

<p>We cooked quesadillas for dinner tonight, and then listened to a talk to a talk by Eugene Chen, a former MIT graduate, about understanding a startup’s finances. We then had our last team meeting, and discussed what the remaining few of us were going to do on Saturday. After a week of work, the screenshot from Sunday night turned into this:</p>

<figure>
<img src="/img/blog/screenshot-2.png" />
</figure>

<h2 id="saturday">Saturday</h2>

<p>I woke up in time for standup, and got to work for our last day at Hack Lodge. Today was another slow day, and we mostly spent it fixing bugs and polishing for final demos. For dinner, we catered Halal Guys, which is for sure one of my favorite places to eat back in NYC! Today was the day I learned they also bad a Boston location.</p>

<p>Again, I wasn’t sure what to expect for final demos, but everyone had a great night. Lots of MIT and Harvard students were invited to come watch, and each team took five minutes to show off their project. Here’s what everyone made:</p>

<ul>
  <li>Catherine worked on her computational linguistics research paper</li>
  <li>Seiji created a data visualization tool to track the funding sources of each part of MIT</li>
  <li>Vaid created an online viewer for MIT confessions</li>
  <li>Walla, Christina, and Zach worked on a universal controller for game consoles</li>
  <li>Robert created a <a href="https://photos.google.com/share/AF1QipNvO5KvO7qPBXMi8uGI4t_qGqcQhk5AHG_PrWaOANUABHFChYdodakINaXVzzPYcg/photo/AF1QipPCwFKD6Wu7Uxmt7ol8OTAaYXIND1RujFtLVzjd?key=WndIQ0pxaXliSm95MDRHWU9GdmVHa2kzdEoxQlBR">functional cardboard piano</a></li>
  <li>Martin added features to his note-taking app, <a href="https://remnote.io">Remnote</a></li>
  <li>Philip implemented matrix multiplication on an FPGA</li>
  <li>Anna worked on a gene mapping algorithm for biology research</li>
  <li>Jay created a distributed scoring app for swimming and diving</li>
  <li>My team created <a href="https://beta.dormsp.am">dormsp.am</a></li>
  <li>Ethan created a logic puzzle game</li>
  <li>Abhi created Alcohelix, a blood-alcohol content tracker</li>
</ul>

<p>I’m super proud of what we made, and grateful for the connections and memories I made over the course of the week. Thank you to everyone who made it so memorable, and thank you especially to Abhi and Anna, who organized HLB!</p>]]></content><author><name></name></author><summary type="html"><![CDATA[I spent a week making projects with friends!]]></summary><media:thumbnail xmlns:media="http://search.yahoo.com/mrss/" url="https://jackcook.com/img/blog/lodge.jpg" /><media:content medium="image" url="https://jackcook.com/img/blog/lodge.jpg" xmlns:media="http://search.yahoo.com/mrss/" /></entry><entry><title type="html">Reflecting on my first semester at MIT</title><link href="https://jackcook.com/2018/12/31/newyear.html" rel="alternate" type="text/html" title="Reflecting on my first semester at MIT" /><published>2018-12-31T00:00:00+00:00</published><updated>2018-12-31T00:00:00+00:00</updated><id>https://jackcook.com/2018/12/31/newyear</id><content type="html" xml:base="https://jackcook.com/2018/12/31/newyear.html"><![CDATA[<p>Now that I’ve been home for about a week, I took some time to think back on what I’ve done over the last few months.</p>

<p>Back in high school, there was only a small handful of groups that brought together students who were interested in learning about computer science outside of the classroom. In contrast, MIT has about a billion different options for students who are interested in technology, which is both a blessing and a curse. While it’s great to be surrounded by thousands of like-minded people, it’s easy to be overwhelmed by the sheer number of opportunities available to everyone. From all of this, here are two of the most important lessons I learned in my first semester at MIT.</p>

<figure>
<img src="/img/blog/outfinite.jpg" />
<figcaption>A photo I took of the "outfinite" after we got our first snow of the year.</figcaption>
</figure>

<h2 id="focus-on-what-you-enjoy">Focus on what you enjoy</h2>

<p>MIT’s generous <a href="https://mitadmissions.org/help/faq/pass-no-record/">pass/no record grading policy</a> gave me plenty of room to explore. Rather than vying for an A on every test, I decided early on that I would use my spare time to try new things and see what stuck. I joined a research group at <a href="https://csail.mit.edu">CSAIL</a>, helped organize <a href="https://hackmit.org">HackMIT</a> and <a href="https://ieee.scripts.mit.edu/conference/">URTC</a>, became a <a href="https://medlinks.mit.edu">MedLink</a>, wrote articles for <a href="https://mlh.io">MLH</a> and <a href="http://murj.mit.edu">MURJ</a>, led a discussion for the <a href="https://mitaiethics.github.io">MIT AI Ethics Reading Group</a>, and made a bunch of friends along the way.</p>

<p>About halfway through the semester, I couldn’t help but feel like I was doing it all wrong. I developed a tendency to jump at each mildly interesting opportunity that came my way, which spread me more and more thin as the semester went on. One Friday morning in early November, I eagerly replied to a job posting from a startup that was looking for an MIT student to do some iOS work part-time. It looked like I fit what they were looking for, and I liked the company’s vision. Later in the day, I thought back to the email I wrote and realized: when would I even have time to work on this? After I received a reply from the startup, I decided to be honest, both with them and with myself. I told them I recognized I actually didn’t have enough free time to take on part-time job, and apologized for my initial email.</p>

<p>After that incident, I became more conservative with the opportunities I decided to pursue. I realized that I needed to be more conscious about how I spent my time each week, and I started thinking about what I wanted to change. Although it took me a couple of weeks to accept this, I eventually figured out that I didn’t truly enjoy my research. I loved my research advisor, but the project I was tasked with matched my skillset perfectly, to the point where I wasn’t learning anything new.</p>

<p>This became a signal to me that it was time to move on. Near the end of the semester, I started emailing professors and postdocs with interesting research projects, this time making sure I wouldn’t make the same mistake. During each interview, I made sure to ask about what I would be doing on a daily basis, since I wanted to take on work that would challenge me and allow me to learn new things along the way. I finally settled on a project with MIT’s <a href="https://quest.mit.edu">Quest for Intelligence</a>, where I’ll soon be using deep learning to classify red blood cells in patients with sickle cell anemia.</p>

<h2 id="take-classes-that-will-help-you-grow">Take classes that will help you grow</h2>

<p>This fall, I also made a point to pick courses that I personally found interesting, even if it meant they would be more time-consuming. One of these classes was <a href="http://catalog.mit.edu/search/?search=21w.035">21W.035: Science Writing for the Public</a>. I remember sitting in my academic advisor’s office on registration day, going over the courses I wanted to take this semester. After listing my computer science classes, I said I wanted to take 21W.035, to which my associate advisor almost winced. “There can be a lot of revision in the writing classes, and I’ve heard that they take up a lot of time. Are you sure you’ll be okay with this on top of your other courses?” I knew I wanted to try a writing class, and besides, I would be on pass/no record. I went forward with it, and could not be happier with how it turned out.</p>

<p>The class did end up taking more time than most humanities classes take at MIT, but it was well worth it to me. The class focuses on communicating topics in science to the public, which we assume to know next to nothing about “science.” As I was writing my first paper, I couldn’t help but realize how much I was actually enjoying the class. Back in high school, pressure to take advanced courses that would look good on a college application pushed me into taking classes like AP English Language and AP English Literature. There aren’t any AP courses on creative writing, or on science writing for that matter. As a result, I spent two years writing rhetorical analysis essays, which are decidedly not for me.</p>

<p>If it weren’t for this class (and my amazing writing professor), I definitely would not have figured out how much I actually enjoy writing. Aside from my work with MURJ and MLH, I have a couple of other pieces coming out soon that I would not have taken on if I had taken a different humanities class this fall. Some MIT students will try to take the easier classes when it comes to fulfilling the humanities requirement (I’m looking at you, <a href="http://catalog.mit.edu/search/?search=21m.600">21M.600</a>), but if anything, this semester taught me that there’s value in enjoying my work both inside and outside of the classroom, even if it takes some effort.</p>

<p>The class also made me want to start writing for myself, which means that I’ve decided to start blogging! I’m planning to write about life at MIT, the projects I take on, and some other stuff here and there. We’ll see what happens :)</p>]]></content><author><name></name></author><summary type="html"><![CDATA[Now that I've been home for about a week, I took some time to think back on what I've done over the last few months.]]></summary><media:thumbnail xmlns:media="http://search.yahoo.com/mrss/" url="https://jackcook.com/img/blog/outfinite.jpg" /><media:content medium="image" url="https://jackcook.com/img/blog/outfinite.jpg" xmlns:media="http://search.yahoo.com/mrss/" /></entry></feed>